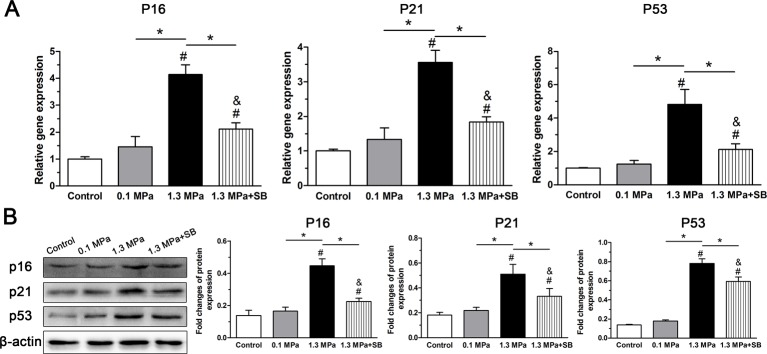
Figure 4. Analysis of senescence markers expression.
Expression of senescence markers (p16, p21, and p53) in NP cells of porcine discs subjected to different compression magnitudes. (A) Real-time PCR analysis of p16, p21, and p53 gene expression. (B) Western blot analysis of p16, p21, and p53 protein expression. The data are expressed as the means±S.D., n=3. # and &: indicate a significant difference compared with the control and 0.1 MPa groups respectively. *: indicates a significant difference between two groups (P<0.05).

