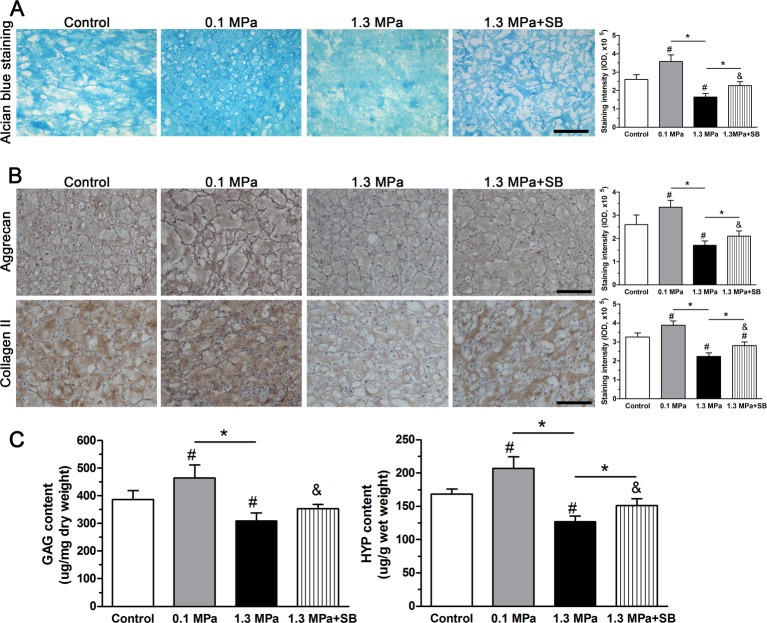
Figure 6. Matrix production analysis.
Matrix production of NP cells of porcine discs subjected to different compression magnitudes. (A) Alcian blue staining assay. (B) Immunostaining of aggrecan and collagen II; magnification: 200×, scale = 100 μm. (C) Measurement of GAG and HYP levels. The data are expressed as the means ± S.D., n=3. # and &: indicate a significant difference compared with the control and 0.1 MPa groups respectively. *: indicates a significant difference between two groups (P<0.05).

