Figure 1.
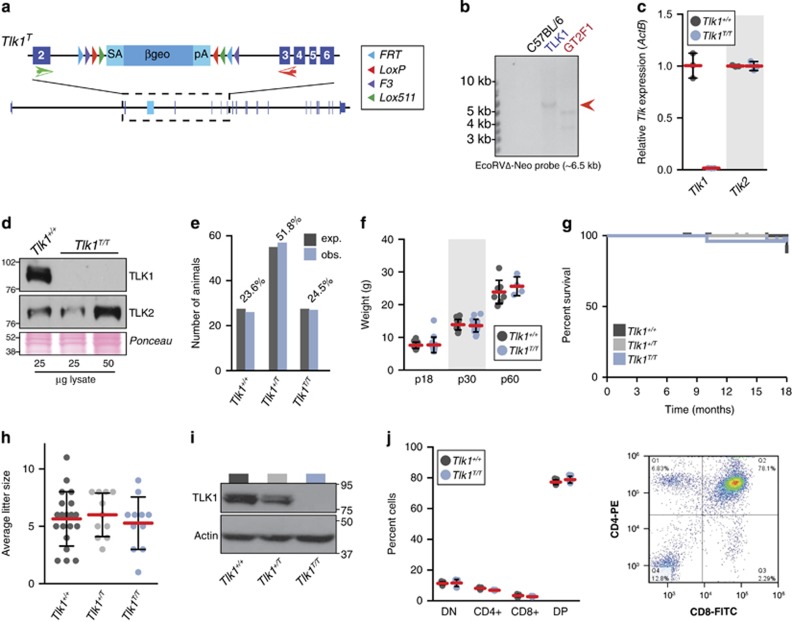
TLK1 is dispensable for murine development. (a) Schematic of the Tlk1 genetrap allele (Tlk1T). The position of the Flex-vector genetrap cassette in the Tlk1 locus and approximate positions of primers used for quantitative real-time PCR are shown. (b) The genetrap clone was screened for single-copy insertion using a probe for the neomycin cassette in a Southern blot of EcoRV-digested genomic DNA. A single band of the expected size was observed (red arrow). GTF2 is an unrelated line with a neomycin cassette (positive control) and C57BL6 is wild-type genomic DNA (negative control). (c) Quantitative real-time PCR analysis of Tlk1 and Tlk2 levels in MEF cultures derived from littermates of the indicated gentoype. The mean (red bar) and standard deviation (S.D.) of three replicates are plotted. (d) Western blotting of TLK1 and TLK2 protein levels in MEF cultures of the indicated genotype. Ponceau red-stained blot showed equal loading. (e) Tlk1T/T mice are born at the expected (exp.) Mendelian ratios. Number of pups of the indicated genotype observed (obs.) from 32 litters of Tlk1+/T mice (110 pups total) is indicated. Percentage observed is indicated above the bar graphs. (f) Normal weight and growth of Tlk1T/T mice. Weights of littermate animals at 18 and 30 days postpartum are plotted with the mean (red bars) and S.D. indicated (n=16 for Tlk1+/+ and 15 for Tlk1T/T, respectively). (g) Normal survival of Tlk1T/T mice. Kaplan–Meier plot of animal survival over 18 months (n=25, 41 and 26 for Tlk1+/+, Tlk1+/T and Tlk1T/T, respectively). (h) Normal litter sizes are observed in Tlk1T/T female mice of 2–5 months of age compared with wild type or heterozygous littermates (n=20, 11 and 11 for Tlk1+/+, Tlk1+/T and Tlk1T/T, respectively). The mean (red bars) and S.D. are plotted and statistical analysis using the Wilcoxon's rank-sum test indicated no significant differences (P=0.65;Tlk1+/+ versus Tlk1+/T, 0.75; Tlk1+/+ versus Tlk1T/T and 0.52; Tlk1+/T versus Tlk1T/T). (i) TLK1 protein levels in thymocytes of the indicated genotype are shown. Actin serves as a loading control. (j) Analysis of T-cell subsets in 2-month-old animals of the indicated genotype (n=3 per genotype, each in triplicate). The mean (red bars) and S.D. are shown and representative flow cytometry data showing CD4 and CD8 staining of CD3-positive T cells is shown in the right panel

