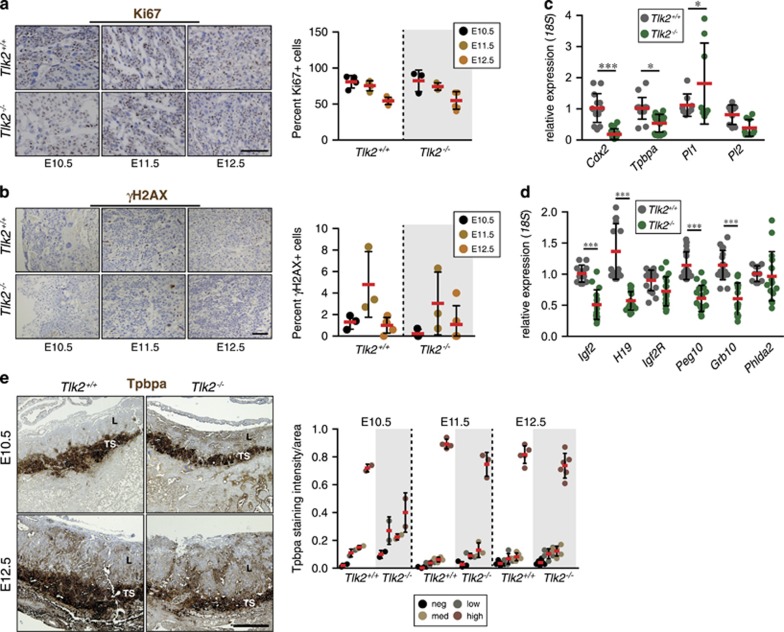
Figure 4.
Proliferation and gene expression in placentas lacking TLK2. (a) Immunohistochemical staining of the proliferative marker Ki67 or (b) the DNA DSB marker γH2AX in E10.5, E11.5 and E12.5 placentas of the indicated genotype. Similar numbers of proliferative cells are visible in the labyrinth of Tlk2−/− placentas compared with wild type at each stage. Mean percent-positive cells (red bars) and S.D. is graphed in right panels. n=3 and 2 at E10.5, n=3 and 3 at E11.5 and n=5 and 6 at E12.5 for Tlk2+/+and Tlk2−/−, respectively. At least 200 total cells were counted for each individual and scale bar in (a) is equal to 10 μm and in (b) is equal to 100 μm. (c and d) Quantitative real-time PCR analysis of genes expressed in trophoblast lineages from E12.5 placenta samples. Combined data represents the mean of triplicate samples from three individual animals of each genotype. Statistical significance was determined using an upaired t-test (***P<0.0001, **P<0.001, *P<0.05). (e) Immunohistochemical staining for Tpbpa reveals a thinner trophospongium (TS) in the absence of TLK2 at both E10.5 and E12.5. The orientation of the labyrinth (L) is also indicated. Quantification of signal intensity distribution in the TS is shown in the right panel, normalized to area. Scale bar=500 μm

