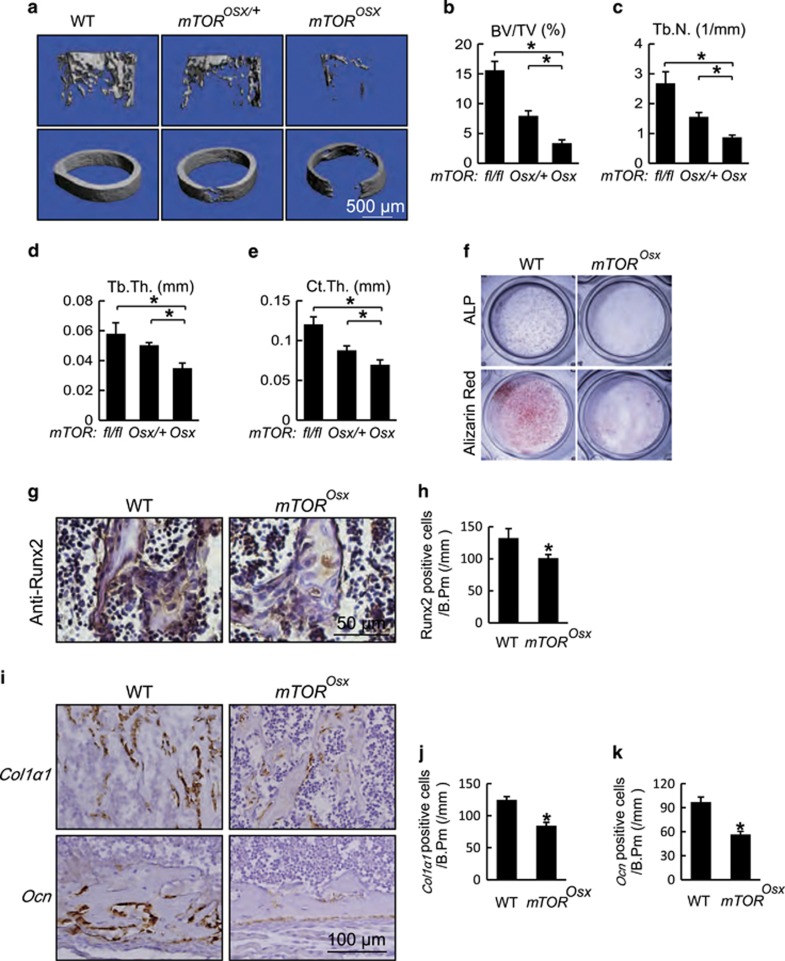
Figure 2.
mTOR deficiency in osteoblasts resulted in reduced bone mass with impaired osteoblast differentiation. (a) Micro-CT images of femur from 4-week-old WT, mTOROsx/+ and mTOROsx littermates. (b–e) Quantitative parameters of Micro-CT. BV/TV: bone volume/total volume, Tb.N.: trabecular number, Tb.Th.: trabecular thickness, Ct.Th.: cortical thickness. Data represent means±s.d. *P<0.05, n=5. (f) Calvarial osteoblasts were cultured with osteogenic medium from 5-day-old WT and mTOROsx littermates. ALP staining and alizarin red staining were performed to analyze osteoblast differentiation on the 7th and 14th day respectively. (g) Immunohistochemistry for Runx2 of distal femur from 7-day-old WT and mTOROsx mice. (h) Number of Runx2-positive osteoblasts counted in the distal femur from 7-day-old WT and mTOROsx mice. Data represent means±s.d. *P<0.05, n=3. (i) In situ hybridizationfor Col1α1 and Ocn in femur from 7-day-old WT and mTOROsx littermaters. (j) Number of Col1α1-positive osteoblasts counted in the trabecular bone of distal femur from 7-day-old WT and mTOROsx littermaters. Data represent means±s.d. *P<0.05, n=3. (k) Number of Ocn-positive osteoblasts calculated in the cortical bone of distal femur from 7-day-old WT and mTOROsx littermaters. Data represent means±s.d. *P<0.05, n=3

