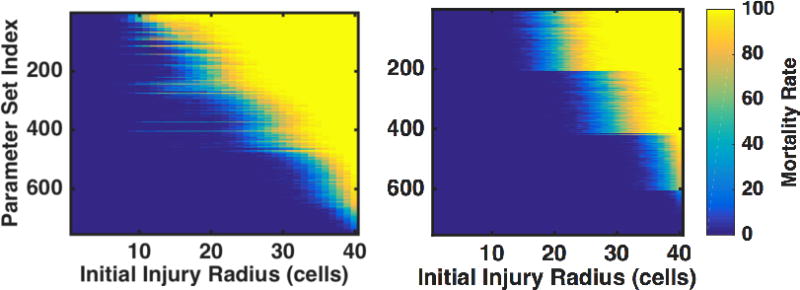
Figure 3.

Heatmaps indicating percentage of death as a function of initial injury size for clinically interesting parameter sets. Patients either went untreated (left) or received antibiotics twice/day for 10 days beginning 6 hours after their injury. Shading indicates the percentage of simulations that lived or died; areas that are dark blue represent complete healing 100% of the time, and areas shaded yellow represent death (either from infection or sepsis) 100% of the time. Note that each row of this figure is essentially a compressed version of Figure 1. Parameter sets are ordered from worst (meaning highest chance of dying at the lowest injury number) on the top to best on the bottom. There is no clear structural relationship between parameter sets for the untreated case (left), though the simulations treated with antibiotics self-stratify based on the host-resilience parameter (with lower host resilience parameters found towards the top of the figure). This stratification is due to the semi-neutralization of microbial virulence through the application of antibiotics.
