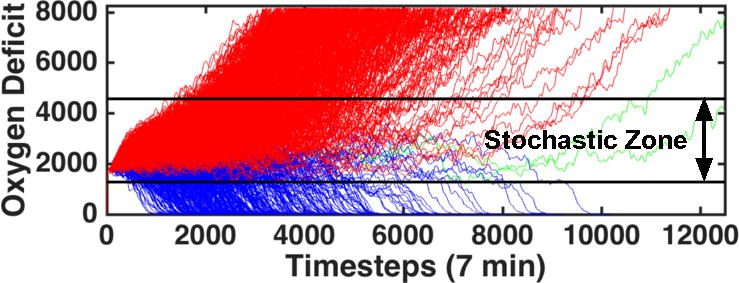
Figure 5.

1000 trajectories of the model using the parameter values (invasiveness=2, toxigenesis=4, environmental toxicity=0, and host resilience=0.1) with an injury size of 22. Oxygen Deficit, the simulation’s primary measure of health, is plotted as a function of time. Trajectories colored in red end in death of the patient; trajectories colored in blue end with complete healing of the simulated patient; trajectories in green had not reached a final outcome by 84 simulated days. The black bars represent the boundary of the stochastic zone (the zone in which stochastic noise is (or can be) more powerful than the influence of either attractor). Each bar is a boundary which, once crossed, ultimately determines the simulation’s fate; if an in silico patient’s health worsens to the point that it crosses the top black bar, then that patient is sure to die and vice-versa.
