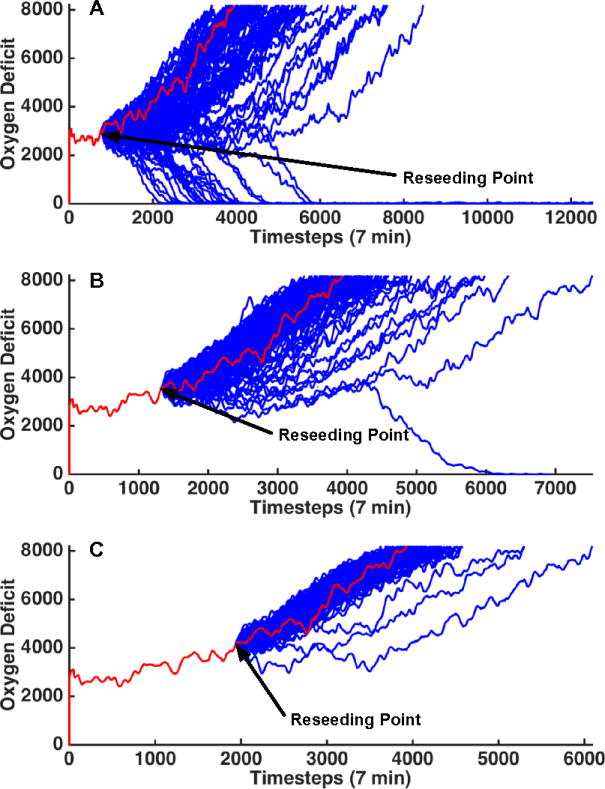
Figure 6.

This figure displays patient trajectories for a single parameter set (invasiveness=2, toxigenesis=4, environmental toxicity=0, and host resilience=0.1) and single initial random number seed. The random number generator was re-seeded 100 times at at oxygen deficit=3000 (top), 3500 (middle) and 4000 (bottom). The original trajectory is shown in red and the trajectories generated from reseeding the random number generator are shown in blue. This image further reinforces the identification of a “stochastic zone” (a region of parameter space in which stochastic noise is (or can be) more powerful than the influence of either attractor). When reseeding in Panel A, the outcome is far from certain and the primary driver for final outcome is stochastic noise. Panel B was re-seeded when the original simulation was in a more unhealthy state (higher oxygen deficit) and this has significantly skewed the range of outcomes to the point that there is only a 1% chance of survival. At this point, stochastic noise is still an important component of the simulation and can overpower the influence of the death attractor, though it is unlikely. In Panel C, the simulation was reseeded at an even unhealthier state. Stochastic noise is no longer a relevant simulation for this simulation as death is a certainty.
