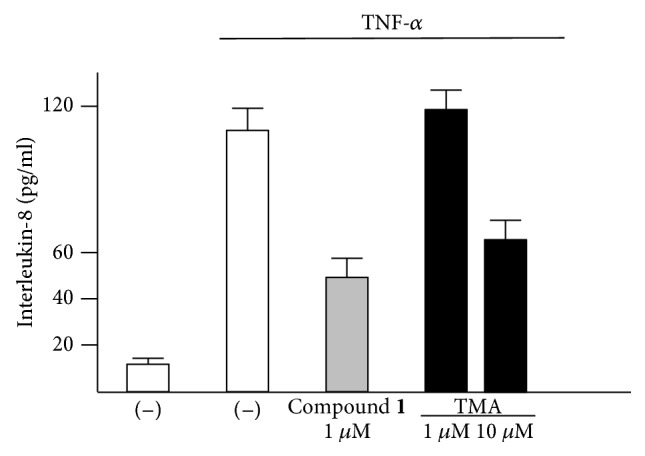
Figure 5.

Bioplex analysis of IL-8 release (pg/ml) in IB3-1 cells induced with TNF-α in the absence and in the presence of compound 1 (1 μM); the effects of 1 μM and 10 μM TMA were included for comparison (n = 3). IB3-1 cells were treated with compound 1 for 5 hours and then stimulated with TNF-α for further 24 hours. The supernatants were analyzed using a Bioplex cytokine assay.
