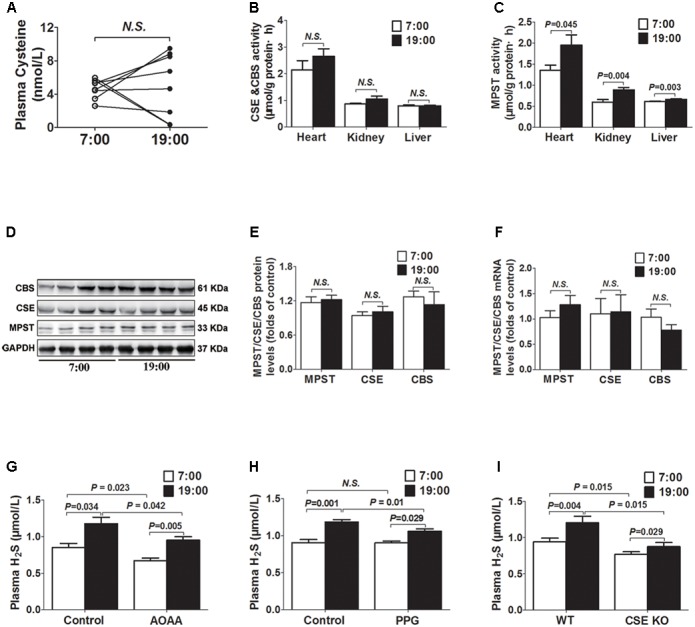
FIGURE 2.

Diurnal fluctuations of plasma H2S were modulated by MPST activity. (A) Cysteine levels in plasma. (B) CSE and CBS activity in tissues. (C) MPST activity in tissues. (D,E) Representative Western blots and quantitative analysis for CSE, CBS, and MPST protein expression in heart tissues. (F) CSE, CBS, and MPST mRNA levels in heart tissues. (G) Plasma H2S levels in AOAA-treatment mice. (H) Plasma H2S levels in PPG-treatment mice. (I) Plasma H2S levels in CSE KO mice. Results are expressed as mean ± SEM. A P of <0.05 was considered significant.
