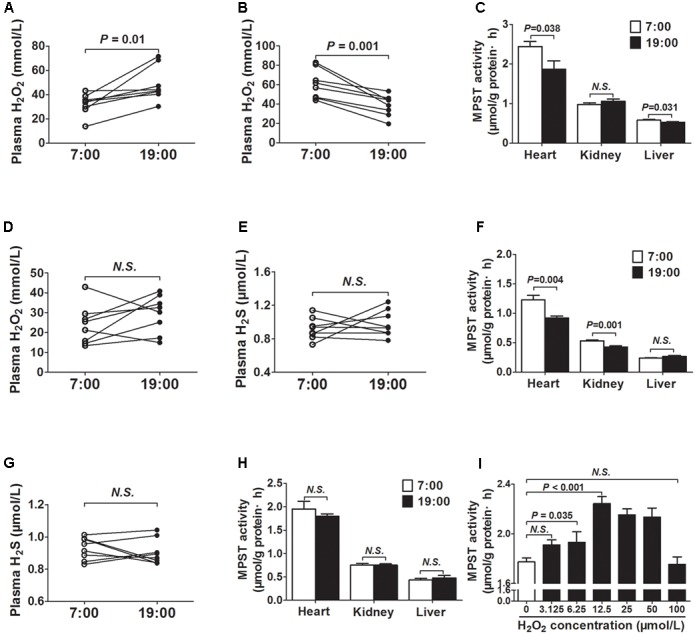
FIGURE 3.

MPST activity was modulated by plasma H2O2. (A) H2O2 levels in plasma. (B) H2O2 levels in plasma from the same mice exposed to continuous light for 24 h. (C) MPST activity in tissues from the same mice exposed to continuous light for 24 h. (D) Plasma H2O2 levels in DTT-treatment mice. (E) Plasma H2S levels in DTT-treatment mice. (F) MPST activity in tissues from the DTT-treatment mice. (G) Plasma H2S levels in SOD2+/- mice. (H) MPST activity in tissues from SOD2+/- mice. (I) MPST activity in heart tissues incubated with increasing concentrations of H2O2 in vitro. Results are expressed as mean ± SEM. A P of <0.05 was considered significant.
