
Figure 3.
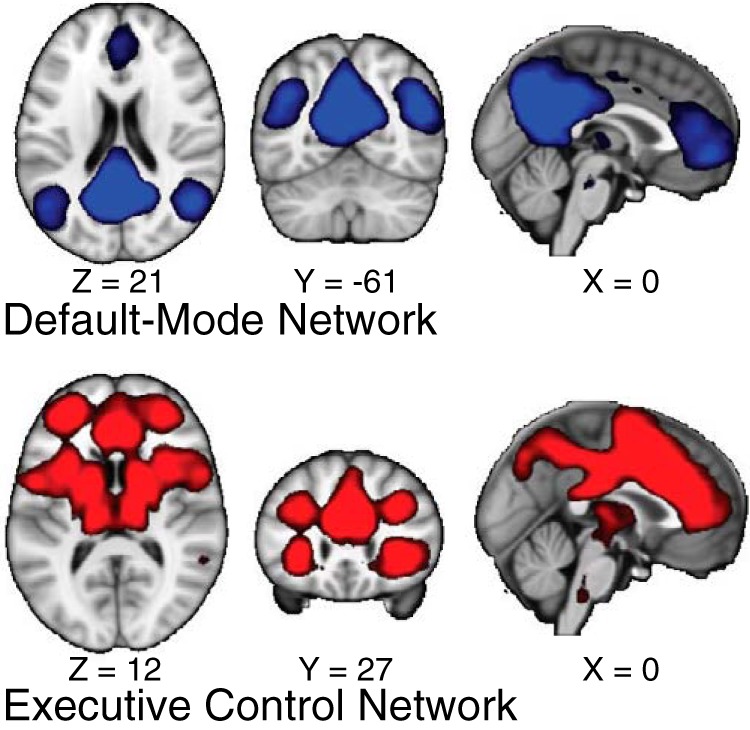
Networks identified from ICA. Using ICA across our task runs, we identified large-scale functional networks. This analysis produced 25 components. Our analyses focused on the components that best matched DMN (highest-correlating component illustrated on top) and the ECN (highest-correlating component illustrated on bottom) from Smith et al. (2009). For visualization purposes, maps are thresholded at Z > 4.