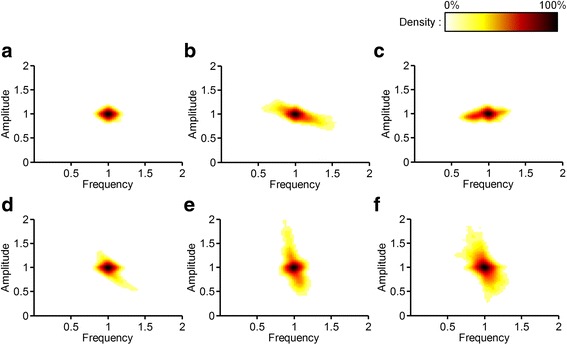
Fig. 3.

The density plots of the six 3-node oscillator models. In these plots, the regulatory characteristics of the frequency and amplitude are represented by the distribution patterns of the density. The density is increasing over a continuum starting from white followed by yellow, red, and black. This figure shows the six network structures: a simple NFO; b activator-amplified NFO; c inhibitor-amplified NFO; d type 1 incoherently-amplified NFO; e type 2 incoherently-amplified NFO; and (f) type 3 incoherently-amplified NFO in order of appearance
