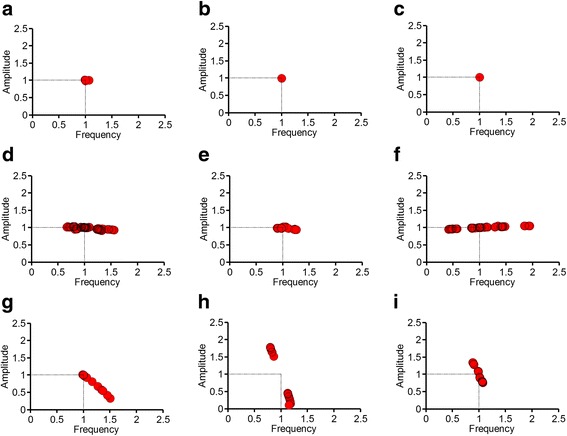
Fig. 5.

Analyses of naturally-occurring biochemical oscillator models. The changes in the frequency and amplitude are represented in the frequency-amplitude plots for the following: a circadian rhythm model by Leloup et al.; b circadian rhythm model by Goldbeter; c repressilator by Elowitz and Leibler; d sinus node model by Yanagihara et al.; e neuronal model by Hodgkin and Huxley; f cell cycle model by Pomerening et al.; g cAMP model by Martiel and Goldbeter; h glycolysis model by Sel’kov; and (i) glycolysis model by Higgins. In these plots, the changes in the frequency and amplitude due to perturbations are expressed as a ratio to the frequency and amplitude before the perturbations
