Fig. 2.

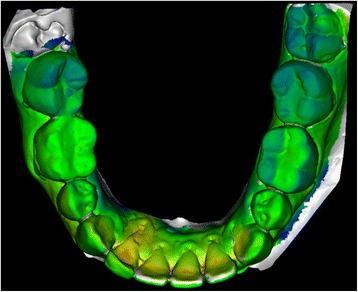
Representation of a superposition of two plaster casts (before and after treatment). Different colors show the amount of position change, which can be measured by the software at any point of interest

Representation of a superposition of two plaster casts (before and after treatment). Different colors show the amount of position change, which can be measured by the software at any point of interest