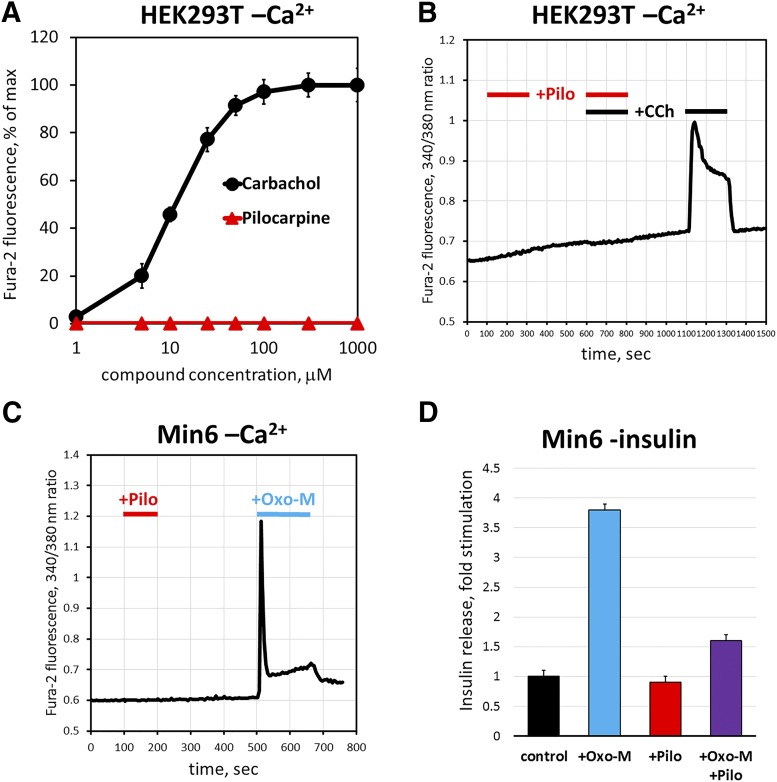
Fig. 2.
Pilocarpine acts as a cholinergic antagonist for endogenous M3R in HEK293T and MIN6 cells. Cells were grown on glass coverslips, loaded with fura-2, AM, and imaged in a flow cell mounted under a fluorescence microscope. Cells were challenged with CCh and pilocarpine solutions, and fura-2 fluorescence was monitored in real time as described under Materials and Methods. (A) Dose-response curve for intracellular free Ca2+ in HEK293T cells in the presence of indicated concentrations of CCh or pilocarpine. The data points show mean peak response ±S.D., n = 3. (B) Pilocarpine (Pilo, 300 μM) was coapplied with 25 μM CCh, which resulted in blockade of calcium increase. After a 5-minute wash with HBSS, the cells were challenged with 25 μM CCh. The trace shows an average of three experiments recording fura-2 fluorescence from 40 to 60 cells. (C) MIN6 cells were challenged first with 300 μM pilocarpine, then with 100 μM Oxo-M, and free Ca2+ was recorded as in (B). (D) Insulin release from cultured MIN6 cells was determined by enzyme-linked immunosorbent assay as described under Materials and Methods; cells were challenged with 100 μM Oxo-M, 500 μM pilocarpine, or their mixture. Data are shown as the amount of insulin released to the medium compared with unstimulated cells (control; 1 μg/ml). Data show mean ± S.D., n = 3, P < 0.01.

