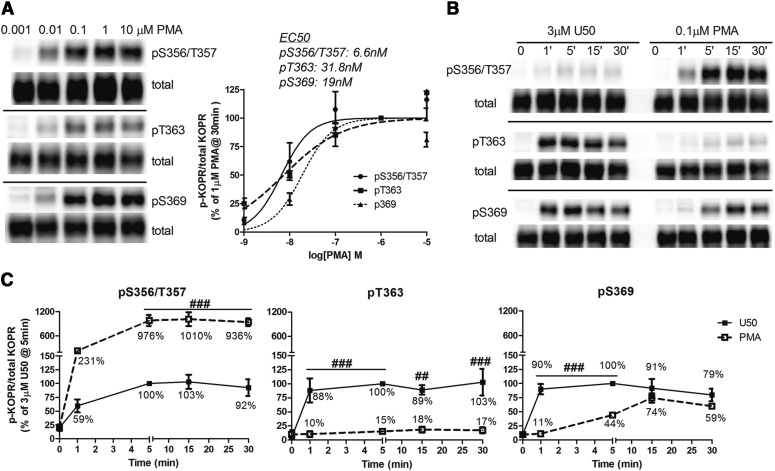
Fig. 6.
Effect of PKC activation on KOPR phosphorylation. (A) Dose-response relationship of PMA-induced KOPR phosphorylation: cells were treated with different concentrations of PMA (0.001, 0.01, 0.1, 1, and 10 µM) for 30 minutes. (B and C) Time course of PMA-induced KOPR phosphorylation and comparison with that of U50,488H: cells were incubated with 3 µM U50,488H or 0.1 µM PMA for 0, 1, 5, 15, and 30 minutes. In (A), staining intensity was normalized against that of 1 μM PMA, and each value is reported as the mean ± S.E.M. (n = 3–4). The mean EC50 values of PMA in promoting phosphorylation at S356/T357, T363 and S369 are shown. In (B), there was an empty lane between U50,488H-treated and PMA-treated samples. In (C), the staining intensity in (B) was normalized against that of U50,488H at 5 minutes. Data are shown as the mean ± S.E.M. (n = 3–4) and were analyzed by two-way ANOVA followed by Bonferroni post hoc test (##P < 0.01, ###P < 0.001, compared with U50,488H-treated group).

