Figure3.

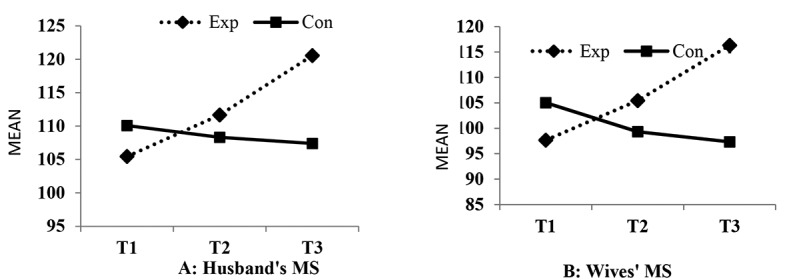
Mean plot of A: husbands’ marital satisfaction and B: wives’ marital satisfaction means scores in both experimental and control groups

Mean plot of A: husbands’ marital satisfaction and B: wives’ marital satisfaction means scores in both experimental and control groups