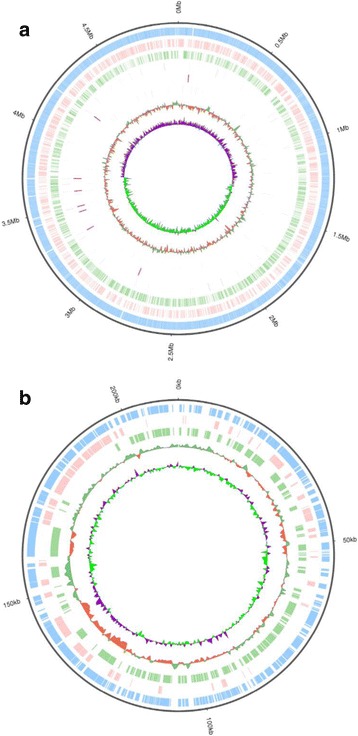
Fig. 1.

Circular representation of the complete genome of C. werkmanii BF-6 (a) and the plasmid pCW001 (b) displaying their relevant features, respectively. a From the inner- to the outermost circle: circle 1, GC skew (positive GC skew in green and negative GC skew in purple); circle 2, GC content; circle 3, sRNA; circle 4, rRNA; circle 5, tRNA; circle 6, genes on reverse strand; circle 7, genes on forward strand; circle 8, all annotated genes; circle 9, genome size. b The circular map of pCW001 was visualized in CGView. The features are the following from center to outside: GC skew, GC content, genes on reverse strand, genes on forward strand, all annotated genes, and plasmid size
