Fig. 3.

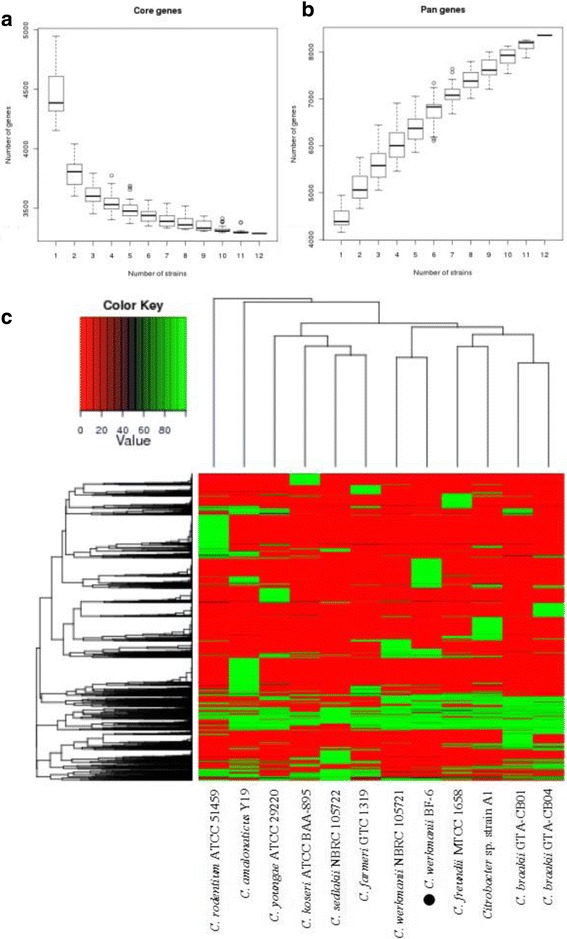
Analysis of the core and pan genome of Citrobacter sp. Dilution curve of bacterial core (a) and pan (b) genes. Heatmap was depicted after core gene deletion with the coverage cutoff >0.5 (c)

Analysis of the core and pan genome of Citrobacter sp. Dilution curve of bacterial core (a) and pan (b) genes. Heatmap was depicted after core gene deletion with the coverage cutoff >0.5 (c)