
Fig. 10.
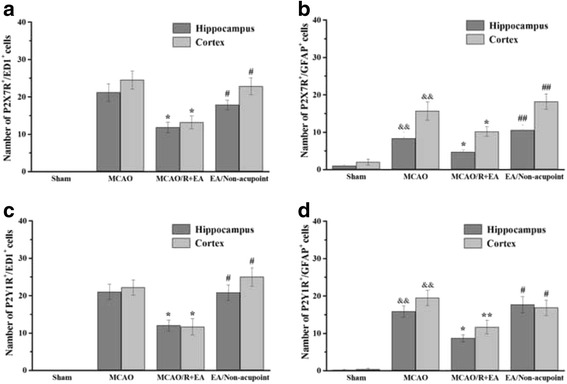
Quantification of co-expression in peri-infarct hippocampal CA1and sensorimotor cortex. Quantification of P2X7R and ED1(a), P2X7R and GFAP(b), P2Y1R and ED1 (c) and P2Y1R and GFAP (d) co-expression showed lower density in the MCAO/R + EA group compared to the MCAO/R group and the MCAO/R+ Non-EA group in peri-infarct sensorimotor cortex. Quantification of P2X7R and ED, P2Y1R and ED1 and P2Y1R and GFAP co-expression showed lower density in the MCAO/R + EA group compared to the MCAO/R group and the MCAO/R+ Non-EA group in peri-infarct hippocampal CA1. Data are shown as mean ± S.E.M from 6 individual rats in each group. && P < 0.01, the MCAO/R group versus the Sham group; **P < 0.01, *P < 0.05, the MCAO/R + EA group versus the MCAO/R group; ## P < 0.01, # P < 0.05, the MCAO/R + EA group versus the MCAO/R+ Non-EA group