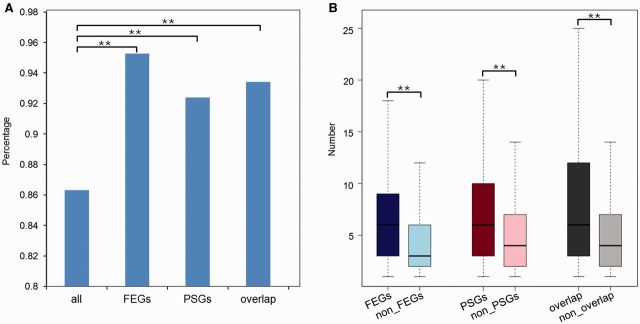
Fig. 3.—
Analysis of Triplophysa lineage-specific nonsynonymous mutations. (A) Percentage of genes having Triplophysa lineage-specific nonsynonymous mutations. “All” represents all the orthologous genes. “Overlap” represents a subset of genes that are both FEGs and PSGs. (B) Number of Triplophysa lineage-specific nonsynonymous mutations among FEGs and non-FEGs, PSGs and non-PSGs, and overlap and nonoverlap of FEGs and PSGs. Significant differences are indicated by asterisks, based on chi-square test (A) and Wilcoxon rank-sum test (B), **P < 0.01.

