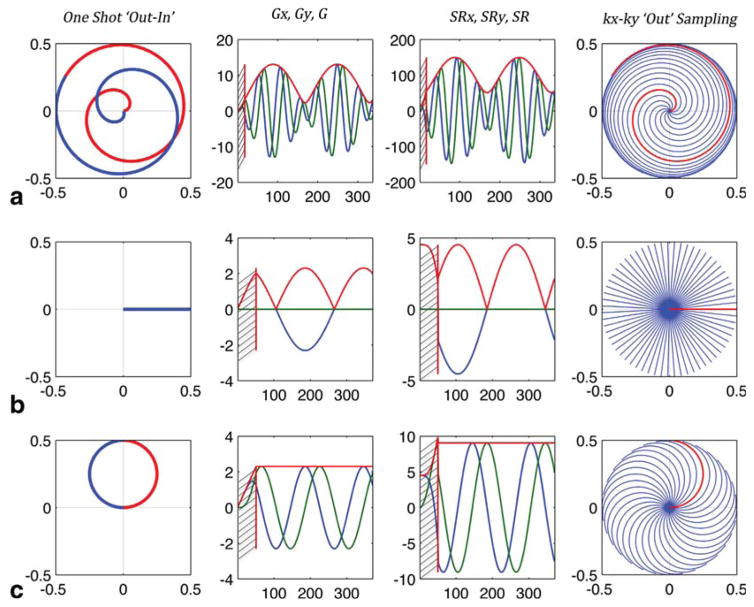
FIG. 1.
Examples of rosette trajectory design for Smax = 150 mT/m/ms, Gmax = 21 mT/m, dt = 10 ms, Nx = 20, FOV = 20 cm, SW = 625 Hz. (a) The fastest coverage as in Schirda et al (10), with slew rate reaching maximum value allowed by the gradient system and . (b) The lowest slew rate and ω2 = 0, with rosette trajectories appearing PI/PREP-like. (c) Corresponds to the balanced approached proposed and used in this study, ω2 = ω1, with trajectories looking like circles sampling periodically k = 0. Left column shows a one-shot trajectory from k = 0 to kmax (“Out”, red) and back to k = 0 (“In”, blue). Second left and second right columns show the gradient readout waveforms and slew rate functions, respectively, for the x-axis (blue), y-axis (green) and strength/magnitude (red). The most right column depicts the (kx, ky) coverage with the “Out” portion of the trajectories, in one temporal slice, in half the spectral dwell time Δtδ/2, where Δtδ = 1/SW. Hashed regions on the gradient and slew rate plots represent transitional, gradient ramp-up regions at the beginning of the readout for each shot (10).

