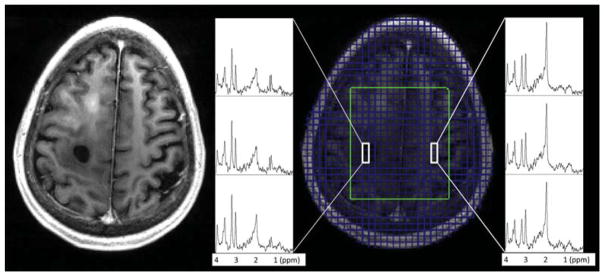
FIG. 8.
Examples of the 3D RSI spectra for SI slice number 8 (highest excited location), for the same GBM patient shown in Figure 7, overlaid here on top of the T1-weighted images. The anatomical image shown is the average of six 1 mm-MPRAGE slices corresponding to the reconstructed SI slice position. Green box – excited LASER VOI. Example spectra displayed correspond to “black hole” ROI (tumor region) and normal appearing tissue. Decreased NAA and increased Choline and Lactate can be seen in the spectra within and around the lesion.

