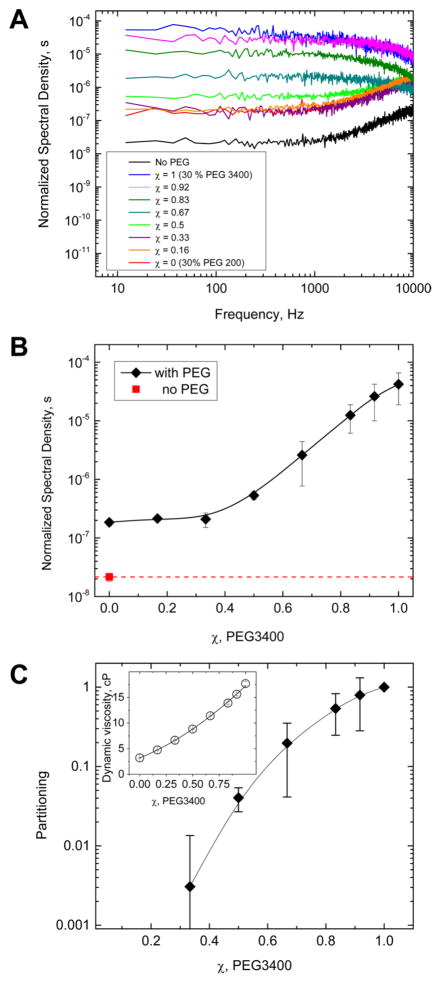
Figure 3.
(A) Power spectral densities of Figure 2C normalized by pore average conductance according to eq 7. The normalization demonstrates that the relative conductance fluctuations are increased by polymer presence for all mixtures. (B) Low-frequency spectral density, S(0)χ, as a function of polymer mixture composition characterized by the relative fraction of PEG 3400, χ. Pores in contact with solutions of the increasing PEG 3400 content display increasing noise intensities at χ > 1/3. (C) PEG 3400 partition coefficient as a function of mixture composition calculated according to eq 11 using dynamic viscosity data shown in the inset.

