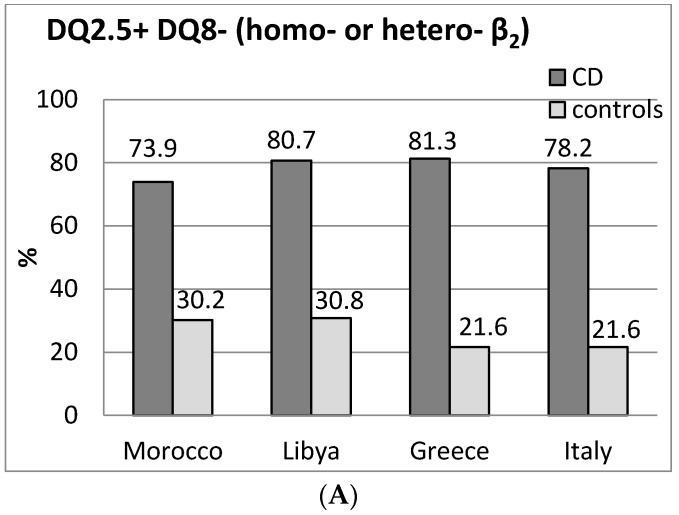
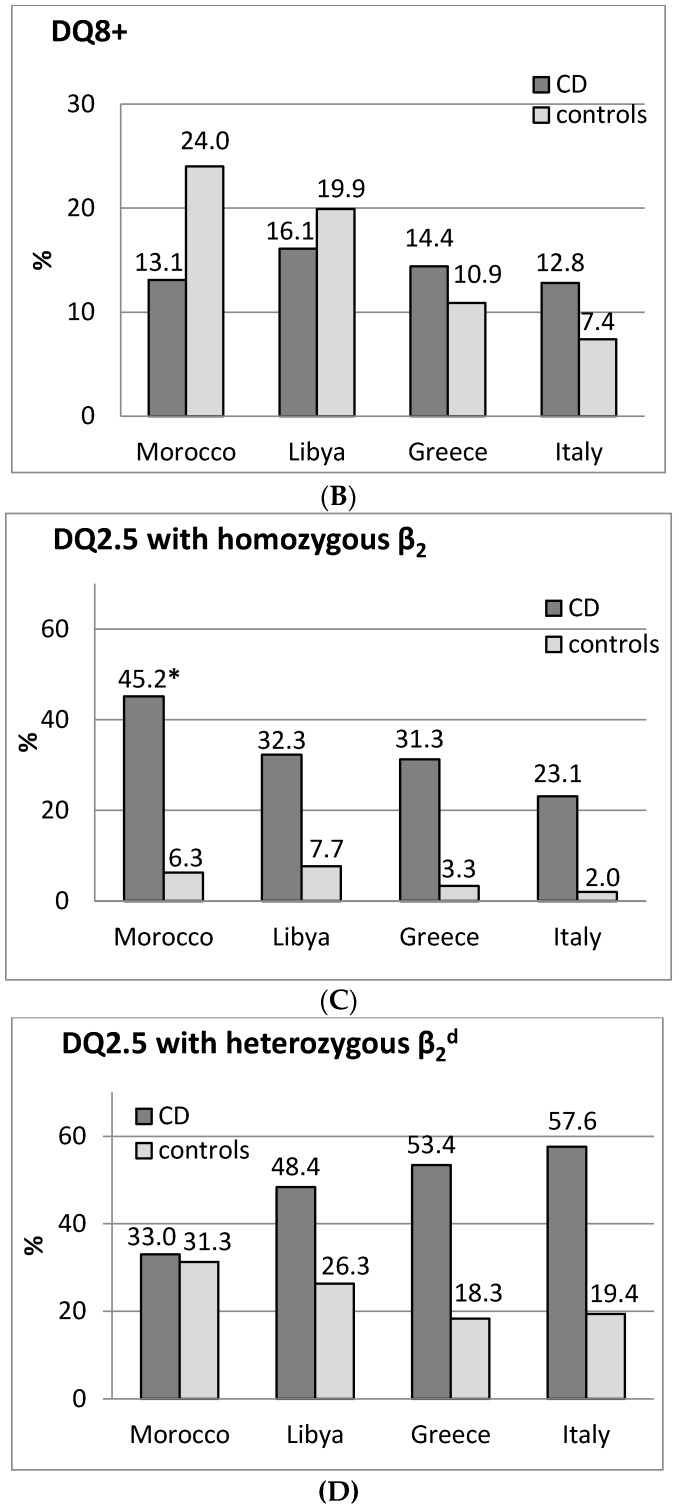
Figure 1.
Distribution of HLA-DR-DQ genotypes in celiac disease (CD) and controls from Morocco a, from North Africa b and from other Mediterranean populations c. Genotype frequencies (%) are reported on the top of the columns. (A) frequencies of DQ2.5 positive/DQ8 negative individuals; (B) frequencies of DQ8 positive individuals; (C) frequencies of DQ2.5 with homozygous β2 chain individuals (DQ2.5 homozygous); (D) frequencies of DQ2.5 with heterozygous β2 chain individuals. * p < 0.001 vs. controls. d Figure 1D includes DQ8+ individuals (DQ2.5/DQ8 genotypes). Population references: a Present study; b Lybia [11]; c Greece [12]; Italy [9].


