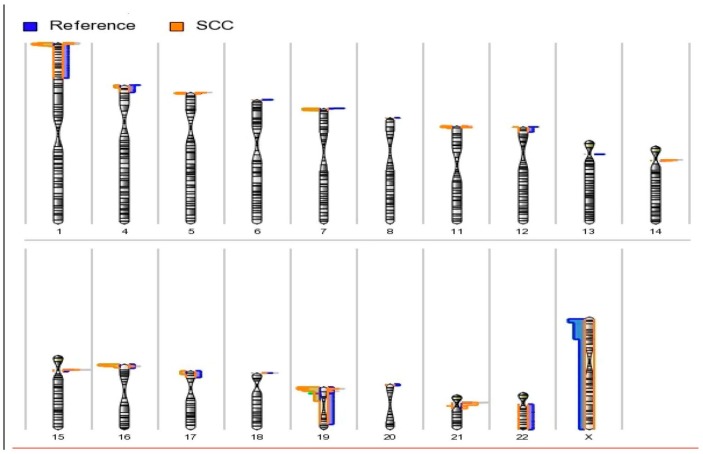
Figure 1.
Karyogram view of detected amplified and deleted regions across autosomes. Amplifications are shown at right side of the chromosomes, and deletions are shown at the left side of the chromosomes. The length of the horizontal bar corresponds to the number of samples observed at the respective cytobands. Most of the amplifications were found in cases at the short arms of chromosomes 1, 5, 8, 16, 19 and 20, as well as the centromeres of chromosomes 14, 15 and 21. Most of the deletions in the cases were mainly observed at the short arms of chromosomes 1, 4, 5, 7, 11, 12, 16, 17 and 19, as well as the centromere of chromosome 19. We observed a statistically-significant difference of CNA burden between case and reference groups (Table 2) for different sizes of CNAs (>100 kb, 10–100 kb and 1–10 kb). For example, statistically-significant differences of >100 kb, 10–100 kb and 1–10 kb deletions were observed between reference (6.7%, 2.5%, 0.8%), pre-cancer (92.5%, 81.5%, 87.7%) and cancer (89.0%, 76.7%, 86.6%) groups, respectively (Table 2).

