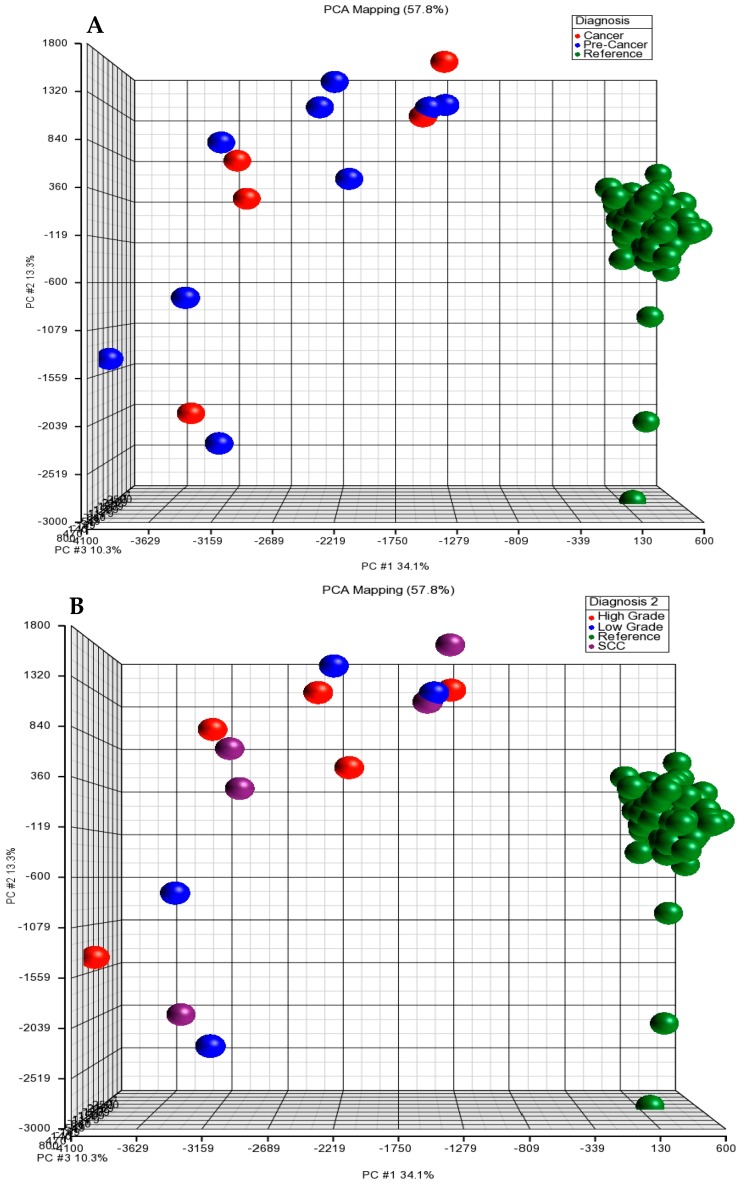
Figure 2.
Plot of principal component analysis (PCA) and hierarchical clustering of copy number variation (CNV) or CNA datasets. (A) PCA scatter plot of three diagnostic groups (pre-cancer, cancer and reference). Each point represents a specific sample. Points are colored by group status, with blue representing pre-cancer (CIN-I, -II and -III), red representing invasive cancer and green representing references. (B) PCA scatter plot of four diagnostic groups. Each point represents a specific sample. Points are colored by group status, with blue representing low grade (CIN-I), red representing high grade (CIN- II and -III), purple representing invasive cancer and green representing references.

