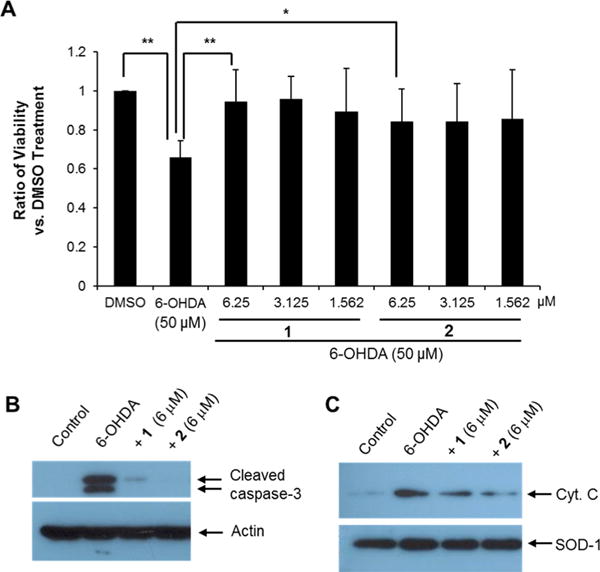
Figure 2.

Inhibition of 6-OHDA-induced cell death by treatment on SH-SY5Y cells with compound 1 or 2. (A) Cellular viability assay with 6-OHDA in the presence or absence of 1 and 2 in SH-SY5Y cells (ANOVA and Tukey–Kramer method, n = 4; * p < 0.05, ** p < 0.01). (B and C) Western blotting analysis of cleaved caspase-3 and the release of mitochondrial cytochrome c into the cytosolic fractions during 6-OHDA-induced cell death with or without 1 and 2 at 6 μM. Actin and SOD-1 showed relatively equal protein loading in each lane.
