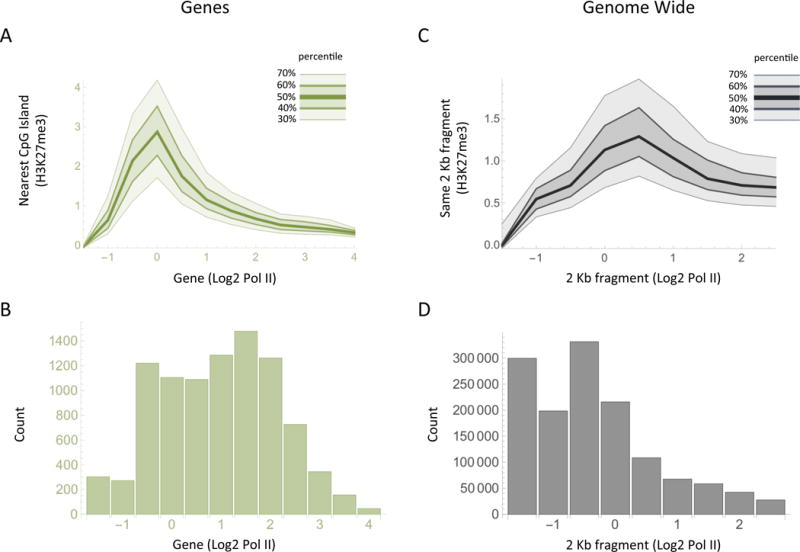
Figure 1. Levels of the Pc mark (H3K27m3) as a function of polymerase at genes and genome-wide.

(A) The plot shows the level of the Pc mark H3K27me3, measured at CpG islands, as a function of the level of Pol II found over the nearest gene as measured from 2 Kb downstream of the promoter to the end of the gene. Each curve represents the percentile (as labeled) of the H3K27me3 measurements at each level of Pol II. (B) The bar chart shows the number of genes bearing the indicated level of Pol II. (C) As in (A), except that Pol II and H3K27me3 levels are compared for individual contiguous non-overlapping 2 Kb fragments throughout the genome. (D) The bar chart shows the number of 2 Kb fragments at each level of Pol II.
