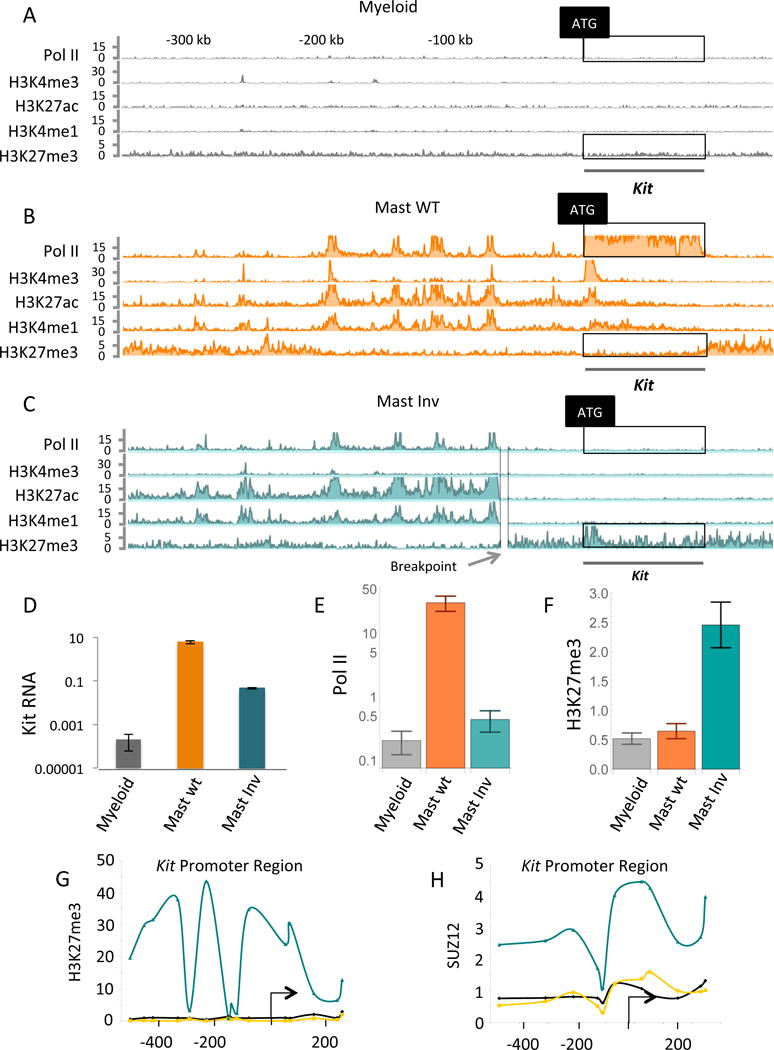
Figure 3. Increased Kit enhancer-promoter separation evokes Pc.

(A), (B) and (C) are ChIP-Endo-Seq experiments probing for the proteins and marks listed on the left of each line. The cells are murine primary mast cells (labeled Mast WT), and murine myeloid cell line 32D (labeled Myeloid). (C) Shows, in addition, the gene-proximal break point of the large chromosomal inversion that greatly increases enhancer-promoter separation (labeled Mast Inv). (D) Kit mRNA levels assayed by qPCR in three cell types as indicated. The significance of the increase in Kit mRNA levels of mast WT over mast Inv: p < 0.0015, of mast WT over myeloid: p < 0.028, and mast Inv over myeloid: p < 0.020. (E) Quantitation of Pol II levels in the boxed regions of the Pol II tracts of A, B and C. The significance of the increase in Pol II levels of mast WT over myeloid: p < 4.4 × 10^−22, mast WT over mast Inv: p < 2.0 × 10 ^−18, and mast Inv over myeloid: p < 0.042. P values were directly calculated by comparing negative binomial distributions (see statistical methods). (F) Quantitation of Pc mark (H3K27me3) in the boxed regions of the Pc tracts of A, B, and C. (G) And (H) show the results of ChIP-qPCR experiments probing for the Pc mark H3K27me3 and for the protein Suz12 at the Kit promoter (myeloid grey lines, mast WT orange lines, and mast Inv cyan lines). The significance of the increase in H3K27me3 levels of mast Inv over mast WT: p < 8.0 × 10 ^−11, and mast Inv over myeloid: p < 3.9 × 10^−13.
