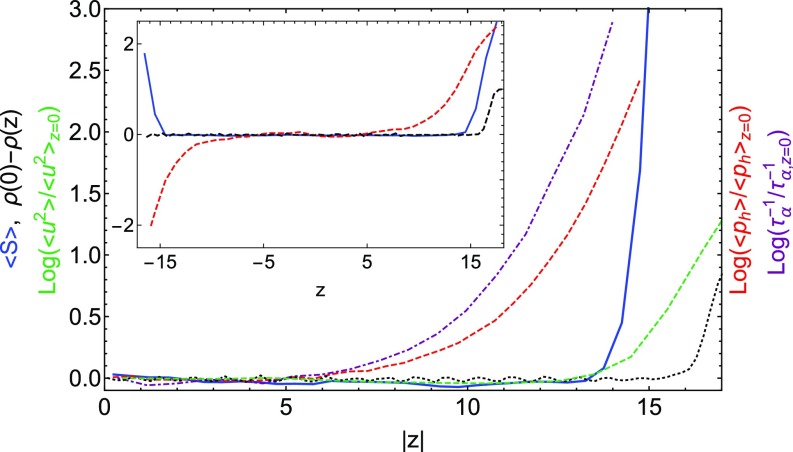
Fig. 1.
From left to right, the curves show (purple dot-dashed curve), (red dashed curve), (solid blue curve), where DW is the local Debye–Waller (DW) factor (green dashed curve), and density profile (black dotted curve). All data are for a freestanding thin film at and (). (Inset) Spatial profile of mean softness (blue solid curve), log of normalized (red dashed curve), and density profile (black dashed curve) for a supported film at and ().

