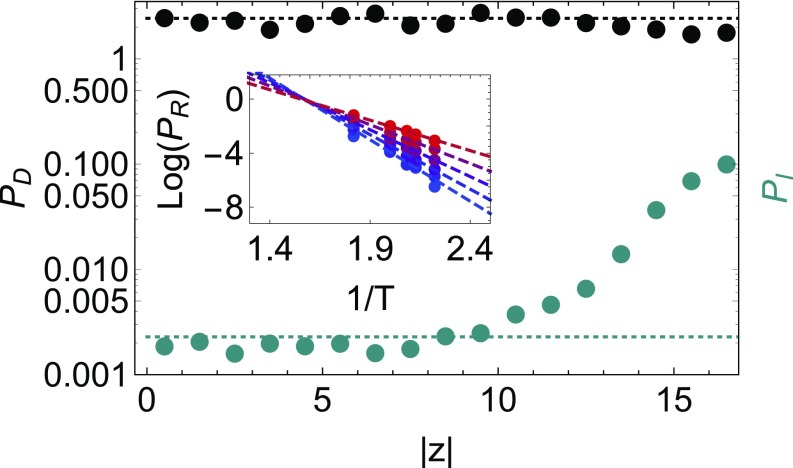
Fig. 3.
Values of (upper, black points) and (lower, teal points) as a function of position within a freestanding thin film at and , derived from the curves in Supporting Information. Dashed lines correspond to the bulk values of these quantities obtained by fitting vs for for bulk samples prepared at different and zero pressure (shown in Inset, with the blue-to-red (bottom-to-top) scale going from to ). Although there are small deviations of the softness-dependent terms very close to the edge of the film, these are small compared with the large enhancement of the softness-independent terms. This enhancement persists on a length scale matching the enhancement of dynamics seen in Fig. 1.

