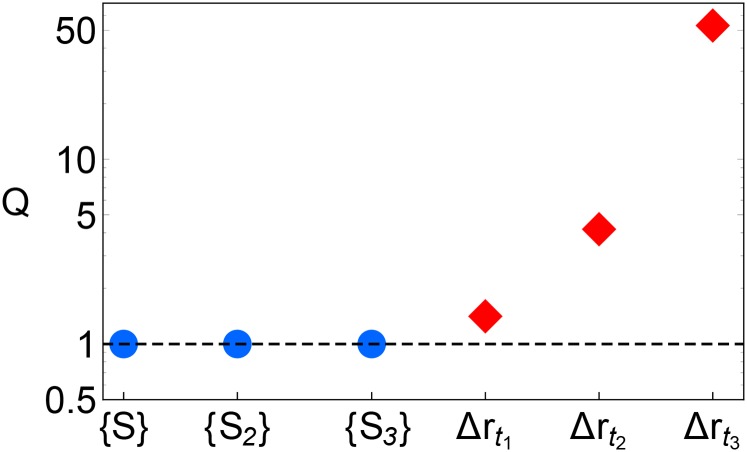
Fig. S3.
-function scores obtained trying to distinguish 2,500 particles near the center versus the edge of the thin film, as a function of the set of structure functions used. The three circles correspond to using only local structural information: are the standard softness, , and .The three diamonds correspond to adding dynamical information (logarithmically spaced data on the magnitude of particle displacement, , out to a maximum time of .

