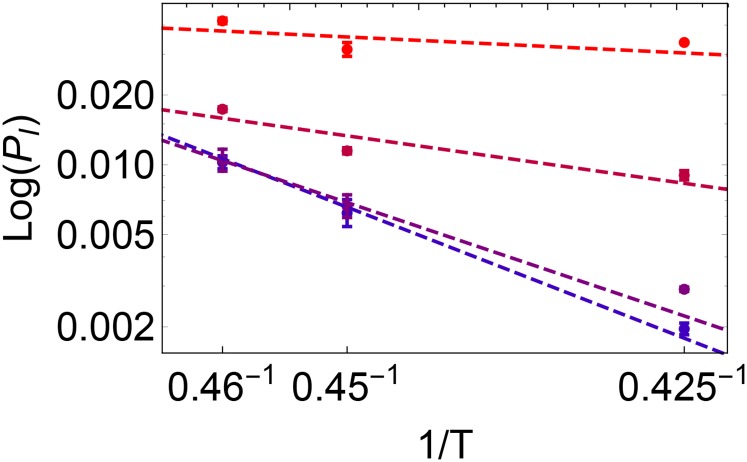
Fig. S7.
The vs inverse temperature. From bottom to top (blue to red), the curves correspond to data in different layers of the film (with respect to the center): , , , and . The error bars for each point are the larger of either (i) the SE of the mean when combining multiple ages together or (ii) the SE of the fit used to extract from the data.

