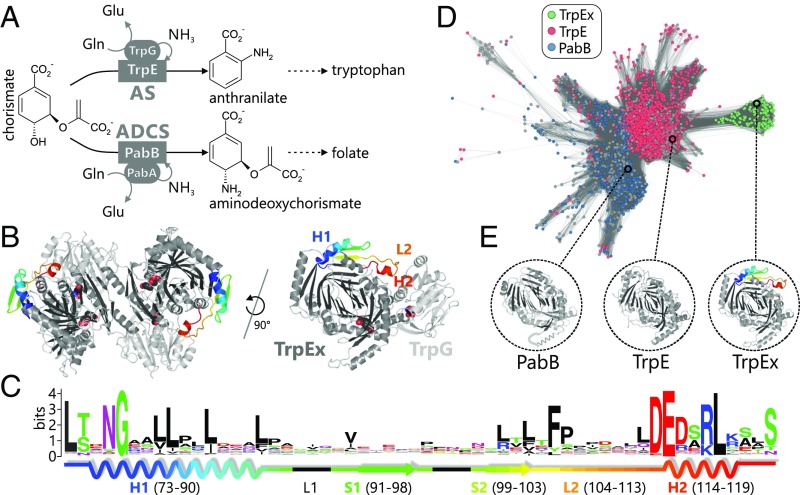
Fig. 2.
Sequence–structure–function relationship in the TrpE(x)/PabB family. (A) Reactions catalyzed by AS and ADCS in tryptophan and folate biosynthesis. Both the glutaminase subunits (ellipses) and the synthase subunits (rectangles) are homologs. (B) TrpEx2:TrpG2 AS complex from S. typhimurium (PDB ID code 1i1q) and one TrpEx:TrpG heterodimer. The interface add-on is colored in a rainbow gradient. Active sites are indicated by superimposed space-filling ligand models. (C) Sequence logo of the TrpEx interface add-on, with its 2D elements indicated. Numbering is based on PDB ID code 1i1q. (D) Main cluster of the TrpE(x)/PabB SSN (IPR019999) generated at an E-value cutoff of 1E-77. It contains all TrpE(x) and most TrpE/PabB sequences. Nodes are colored according to the annotation of InterPro (TrpE or PabB). Gray nodes represent sequences with ambiguous annotation. TrpEx nodes are colored green after manual identification of the interface add-on in nodes annotated as TrpE. (E) Crystal structures of TrpEx from S. typhimurium (PDB ID code 1i1q), TrpE from M. tuberculosis (PDB ID code 4pen), and PabB from E. coli (PDB ID code 1k0e, a helix that is not resolved is sketched in cartoon representation).

