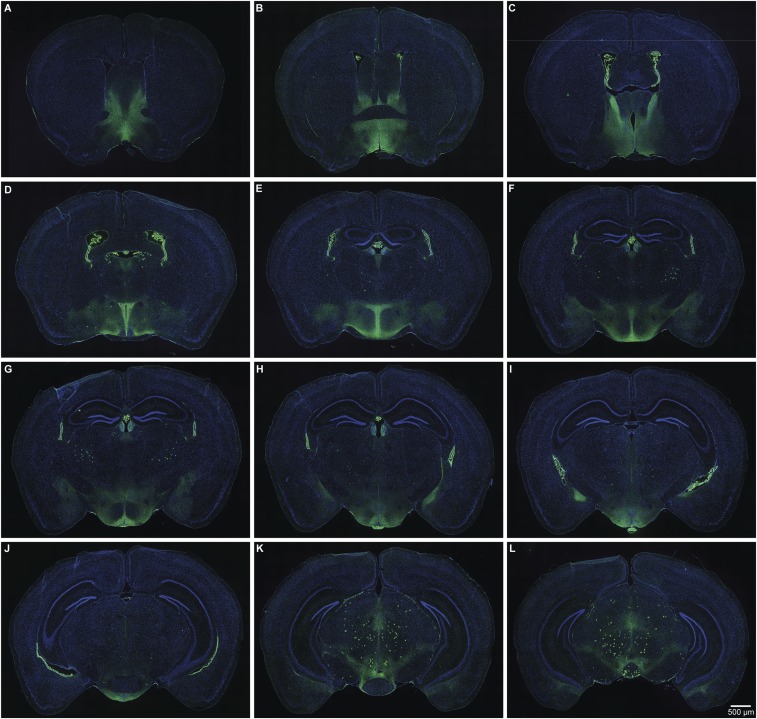
Fig. S1.
Serial sections through a single animal showing the distribution of τGFP-labeled Prlr-expressing cell bodies and fibers in Prlr-iCre/eR26-τGFP mice. Images were captured using a 10× objective using a Zeiss Axio Imager2 microscope with a motorized stage, with multiple images combined to form a composite image using the MozaiX module in the Axiovision software. Note high levels of labeling in the anteroventral periventricular region (A); MPOA (B); BNST (B and C); choroid plexus (B–J); PVN (D and E); ARN, VMH, and median eminence (G–I); medial amgydala (H and I); and VTA (J–L).

