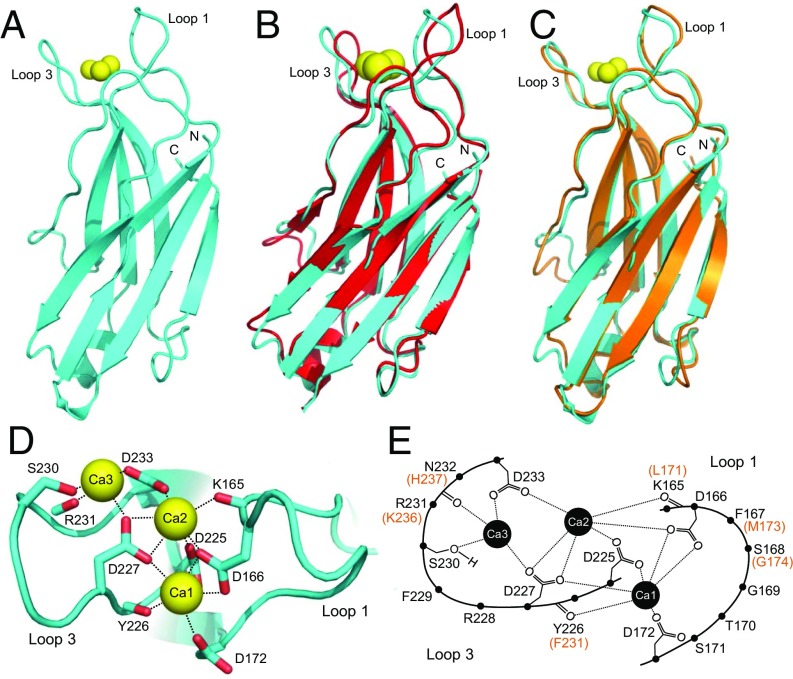
Fig. 1.
Crystal structure of the Ca2+-bound Syt7 C2A domain. (A) Ribbon diagram of the crystal structure of the Ca2+-bound Syt7 C2A domain. The three bound Ca2+ ions are shown as yellow spheres. The two loops involved in Ca2+ binding are indicated (loop 1 and loop 3), and the N and C termini are labeled N and C, respectively. (B) Superposition of the crystal structure of the Ca2+-bound Syt7 C2A domain (cyan) with the solution structure of Ca2+-free Syt7 C2A domain (red) (PDB ID code 2D8K). (C) Superposition of the crystal structure of the Ca2+-bound Syt7 C2A domain (cyan) with the solution structure of Ca2+-bound Syt1 C2A domain (orange) (PDB ID code 1BYN). (D) Diagram illustrating the Ca2+-binding sites of the Syt7 C2A domain. The three bound Ca2+ ions are labeled Ca1, Ca2, and Ca3. The Ca2+ ligands are shown as stick models and labeled. (E) Diagram of the Ca2+-binding sites of Syt7 C2A domain summarizing all of the residues in loops 1 and 3 (black letters). The residues that are different in the Syt1 C2A domain are indicated in parenthesis in red letters.

