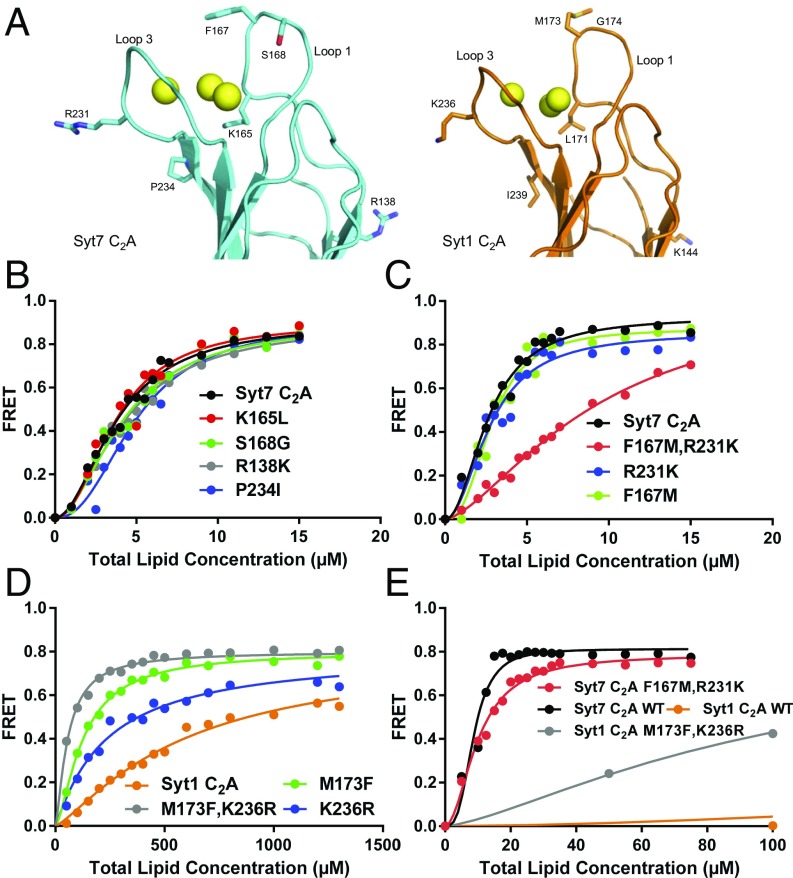
Fig. 7.
Subtle residue substitutions underlie in part the stronger membrane binding affinity of the Syt7 C2A domain compared with the Syt1 C2A domain. (A) Ribbon diagrams of the Syt7 C2A domain (cyan) and Syt1 C2A domain (orange) showing the Cα and side chain atoms of residues that are different in their Ca2+-binding regions and were mutated to analyze the basis for their different membrane affinities (oxygens are in red, nitrogens in blue, sulfur atoms in yellow, and carbon atoms in cyan for Syt7 and in orange for Syt1). (B and C) Titrations of 20 nM WT and mutant Syt7 C2A domains with liposomes in the presence of 1 mM Ca2+. Binding was monitored from the FRET developed between a donor BODIPY-FL probe attached to the proteins and a rhodamine acceptor present in the liposomes. Each point represents the average of at least three measurements performed with different liposome preparations. (D) Analogous liposome titrations of 100 nM WT and mutant Syt1 C2A domains. (E) Analogous liposome titrations of 100 nM WT and mutant Syt1 and Syt7 C2A domains. Note that the data obtained for WT and M173F,K236R Syt1 C2A domains (orange and gray circles, respectively) are the same as those shown in D, but the scale of the x axis is different to allow comparison with the data obtained for the WT and mutant Syt7 C2A domains. All of the data were fit to a Hill function.

