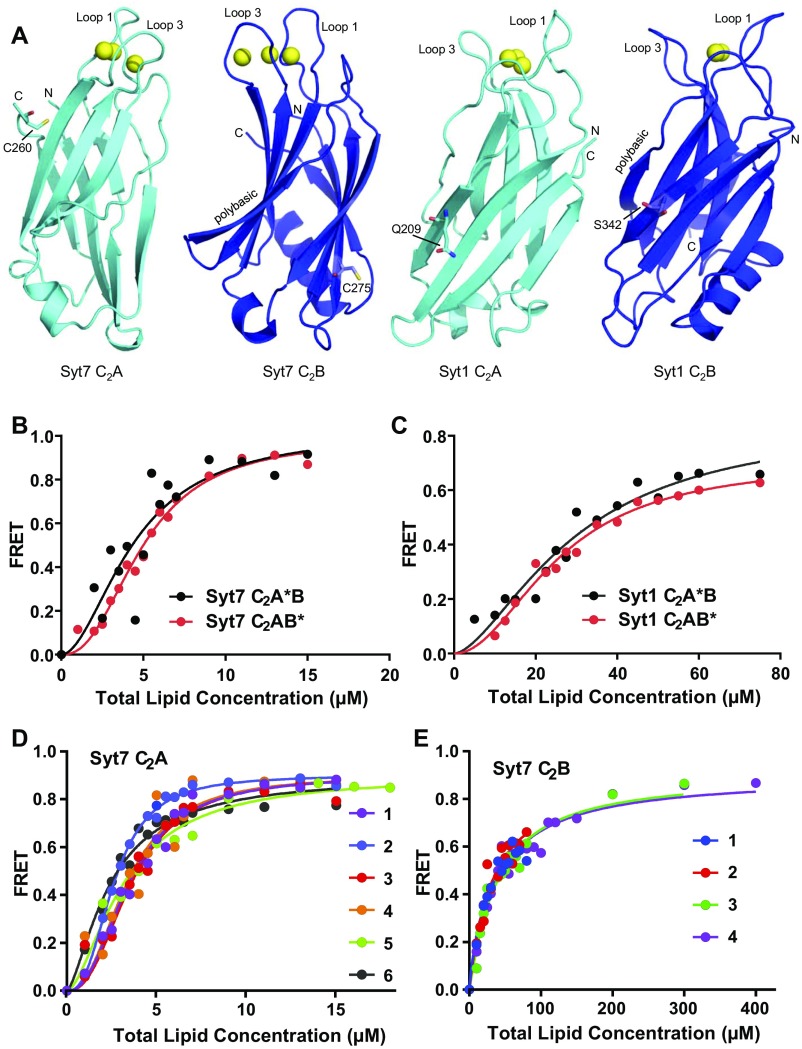
Fig. S2.
Placing the fluorescent probe on the C2A or C2B domain does not alter phospholipid binding to the Syt1 or Syt7 C2AB fragment. (A) Ribbon diagrams of the structures of the Syt7 and Syt1 C2A or C2B domains, as indicated. The structure of the Syt7 C2A domain is described here. Those of the Syt7 C2B domain, the Syt1 C2A domain, and the Syt1 C2B domain correspond to PDB ID codes 3N5A, 1BYN, and 1K5W, respectively. The bound Ca2+ ions are shown as yellow spheres. The two loops involved in Ca2+ binding are indicated (loop 1 and loop 3), and the N and C termini are labeled N and C, respectively. The native cysteine side chains of the Syt7 C2A and C2B domains, as well as the side chains that were mutated to cysteine in the Syt1 C2A and C2B domains to attach a fluorescent probe, are shown as stick models. (B) Titrations of 20 nM Syt7 C2A*B and C2AB* fragments (where the * indicates the domain where the fluorescent probe was attached) with liposomes in the presence of 1 mM Ca2+. Binding was monitored from the FRET developed between a donor BODIPY-FL probe attached to the proteins and a rhodamine acceptor present in the liposomes. Each point represents the average of at least three measurements performed with different liposome preparations. (C) Analogous liposome titrations of 100 nM Syt1 C2A*B and C2AB* fragments. All of the data were fit to a Hill function. (D and E) Superpositions of the data obtained in analogous titrations of 20 nM Syt7 C2A domain (D) or Syt7 C2B domain (E), illustrating the reproducibility of the results. Each symbol represents one dataset obtained with a different liposome preparation. The apparent KDs derived for the six datasets shown in D are 1.49, 2.35, 2.62, 2.42, 2.37, and 3.17 μM, and those derived for the four datasets shown in E are 34.1, 31.4, 38.1, and 36.4 μM. The Syt7 C2B domain data provide an example with small variability among different titrations while the Syt7 C2A domain data illustrate an example with the largest variability, which is reflected in a larger SD in relative terms (Table 1). Even in this case, the data exhibit excellent consistency that allows accurate comparison with the binding curves obtained for other proteins.

