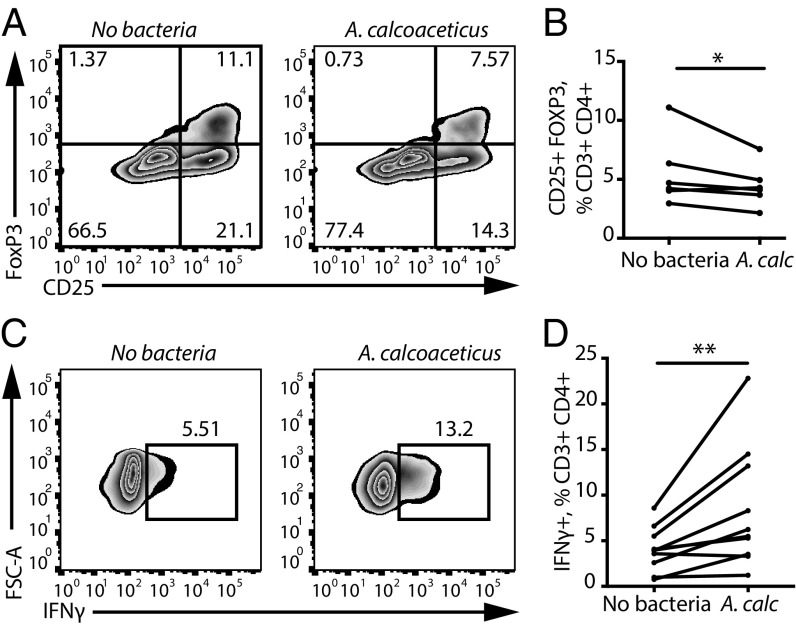
Fig. 3.
A. calcoaceticus inhibits Treg differentiation and stimulates Th1 differentiation in vitro. (A and B) Representative flow cytometry plots (A) and quantification (B) of CD25+FoxP3+ cell differentiation within the CD3+CD4+ population in response to A. calcoaceticus (A. calc) (n = 6 PBMC donors). (C and D) Representative flow cytometry plots (C) and quantification (D) of IFNγ+ Th1 lymphocytes within the CD3+CD4+ population in response to A. calcoaceticus (A. calc) (n = 11 PBMC donors). *P < 0.05, **P < 0.01, two-tailed repeated-measures t test. Data are shown as mean ± SEM.

