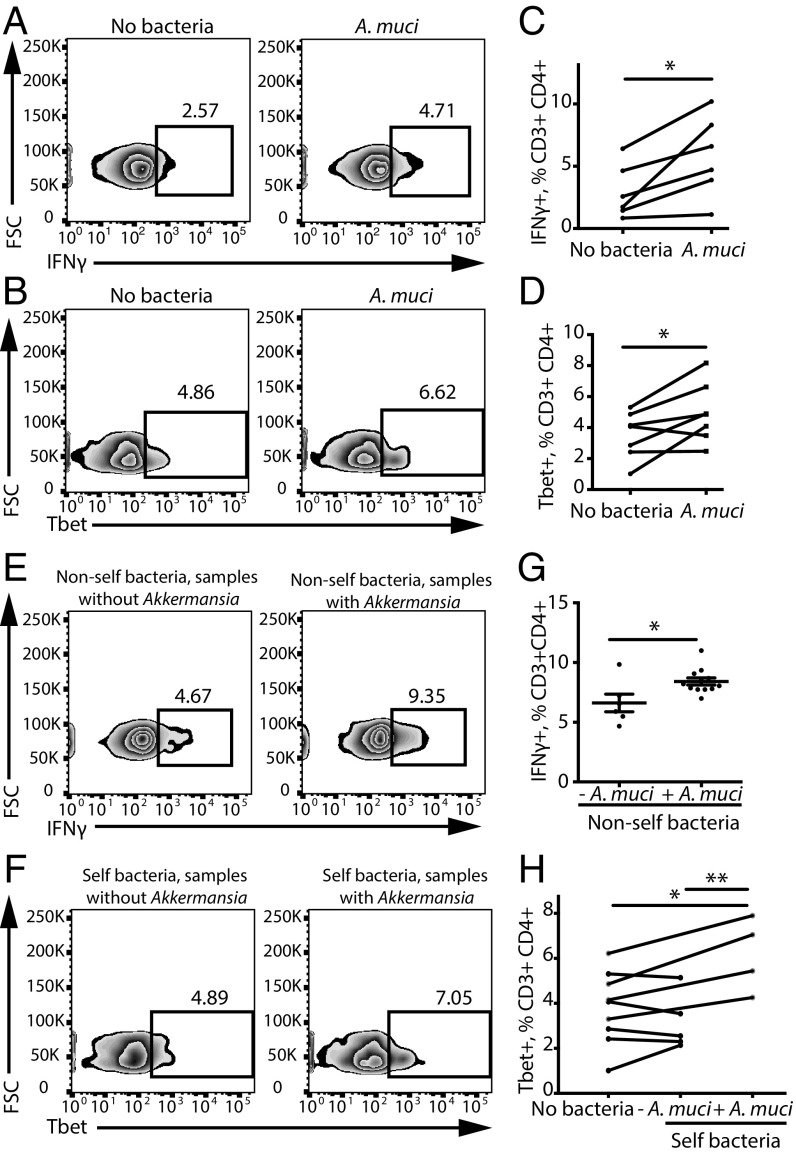
Fig. 4.
A. muciniphila increases Th1 lymphocyte differentiation in vitro. (A–D) Representative flow cytometry plots (A and B) and quantification (C and D) of IFNγ+ and of Tbet+ Th1 lymphocytes within the CD3+CD4+ population in response to A. muciniphila (A. muci). n = 6 PBMC donors for the IFNγ experiment; n = 7 PBMC donors for the Tbet experiment. *P < 0.05, two-tailed repeated-measures t test. (E–H) Representative flow cytometry plots (E and F) and quantification (G and H) of IFNγ+ Th1 lymphocytes within the CD3+CD4+ population in response to nonself or self bacteria from subjects with or without detected A. muciniphila. n = 6 subjects without A. muciniphila; n = 12 subjects with A. muciniphila. *P < 0.05, two-tailed t test; **P < 0.01, two-way ANOVA for repeated measures. Data are shown as mean ± SEM.

