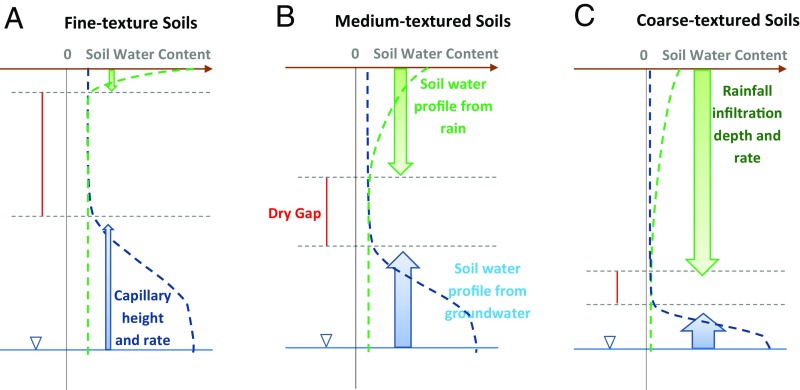
Fig. 5.
Schematic of how soil texture regulates the two soil water fluxes and profiles: from the top, precipitation infiltration flux (green arrows) and the resulting soil water profile (green dashed line), and from below, the groundwater capillary rise (blue arrows) and resulting soil water profile (blue dashed line), in (A) fine-textured, for example, clay, (B) medium-textured, for example, silt, and (C) coarse-textured, for example, sandy, soils. The width of the arrow indicates flux rate, and the length indicates flux reach, with equal precipitation and WTD.

