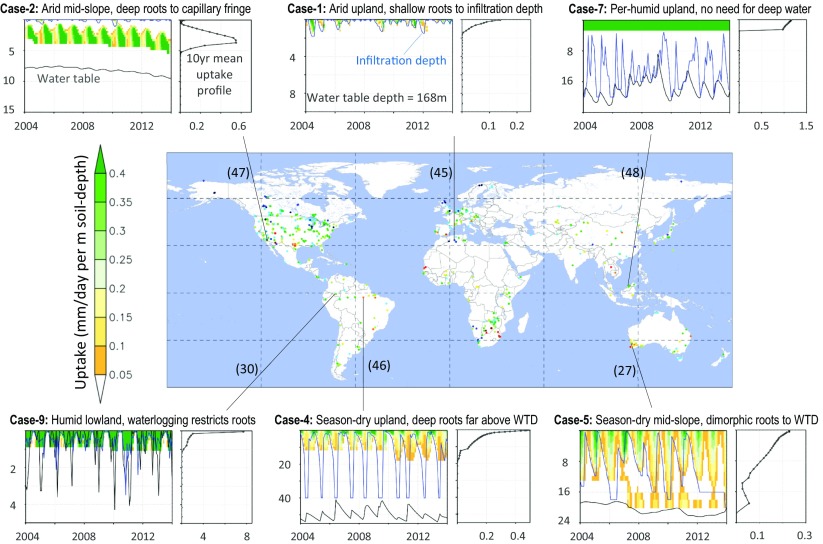
Fig. 7.
Modeled uptake profiles at six grid cells with rooting depth observations (27, 30, 45–48), corresponding to six cases in the conceptual model of Fig. 4. The colored panels plot monthly root water uptake (in millimeters per day per meter soil depth) over the 10 y of simulation, at different soil depth (in meters), with monthly mean infiltration depth (blue line) WTD (gray line). The 10-y mean uptake profile is shown to the Right. The map at Center is a reduced version of Fig. 2. The model exhibits the same behavior as observations under different climate/drainage combinations. In the desert, observations are of single plants not detectable by satellites, so model results of a nearby grid are shown, which have higher leaf area index and thus deeper uptake than observed.

