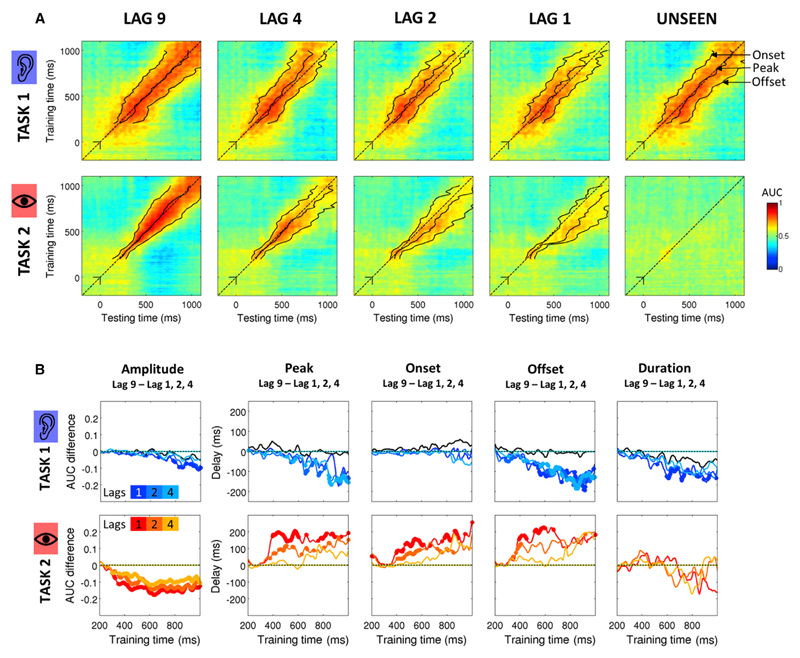
Figure 3. Temporal Generalization of Classifiers Reveals How Dual-Task Interference Impacts Task 1 and Task 2 Chains of Processes.
(A) Temporal generalization matrices for Task 1 (top rows) and 2 (bottom rows) for each Lag condition and for unseen trials. In each panel, a classifier was trained at each time sample (vertical axis: training time) and tested on all other time samples (horizontal axis: testing time). The dotted line corresponds to the diagonal of the temporal generalization matrix, i.e., a classifier trained and tested on the same time sample. For each classifier, we measured the onset, the peak, the offset, the duration, and the amplitude of the classification time course. Solid lines here represent the median peak latency, onset, and offset of each classifier.
(B) Colored lines indicate the median difference between Lag 9 and the other lags (dark, medium, and light colors for Lag 1, 2, and 4, respectively). Taking the peak latency as an example, a value of 0 on the y axis for a given condition means that the peak of the prediction performance had the same timing as in the Lag 9 condition. Negative and positive values indicate that the peak was shifted to earlier and later latency, respectively. Significant differences (signed-rank across subjects, FDR corrected) between the Lag 9 condition and the other condition of interest are depicted with a thick line. For display purposes, data points were smoothed using a moving average with a window of five samples.

