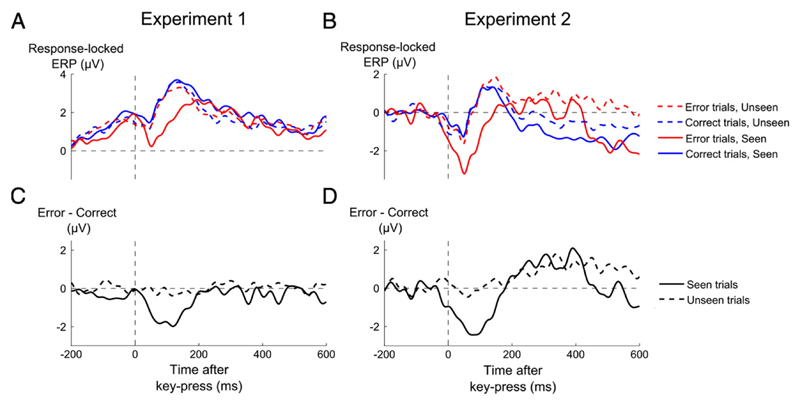
Fig. 4.
Time courses of event-related potentials as a function of objective performance and visibility. (A,B) Grand-average event-related potentials (ERPs) recorded from a cluster of central electrodes (FC1, FC2, C1, Cz, C2), sorted as a function of whether performance was erroneous (red lines) or correct (blue lines), and whether the target was seen (solid lines) or unseen trials (dashed lines), for experiment 1 (A) and experiment 2 (B). (C,D) Difference waveforms of error minus correct trials, separately for seen (solid line) and unseen (dashed line) trials.

