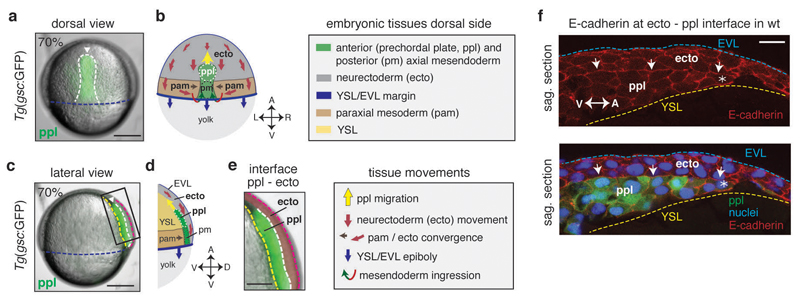
Figure 1. Neurectoderm (ecto) and prechordal plate (ppl) morphogenesis during gastrulation.
(a,c) Bright-field/fluorescence images of a Tg(gsc:GFP) zebrafish embryo at 7.0hpf; GFP-labeled ppl leading edge cells are indicated (white arrowheads); rectangle in (c) marks magnified area in (e); dashed lines in (a) indicate axial mesendoderm (white), and in (c) ecto-to-ppl (white), yolk syncytial layer (YSL)-to-ppl (yellow), enveloping layer (EVL)-to-media (purple) and EVL-to-YSL (blue) interfaces; embryonic axes orientation as marked in (b,d) for same views.
(b,d) Illustration of embryonic [anterior (ppl) and posterior axial mesendoderm (pm), paraxial mesoderm (pam) and ecto] and extra-embryonic [YSL, EVL, yolk) tissues, and their respective direction of movement during gastrulation at the dorsal side of the zebrafish embryo; arrows in (b,d) indicate animal-vegetal (A-V), left-right (L-R), and dorsal-ventral (D-V) embryonic axes.
(e) Magnified view of the boxed area in (c) showing neighboring ppl (green) and overlying ecto (red pseudocolored) tissues; dashed lines as in (c).
(f) Immunofluorescence confocal images of sagittal sections of the ecto-to-ppl interface at 7.5hpf stained for E-cadherin (upper panel) and merged with ppl progenitors expressing gsc:GFP and DAPI-stained nuclei (lower panel); arrows highlight E-cadherin accumulations at ecto-to-ppl interface, and asterisks mark ppl leading edge cells; blue dashed line indicates EVL-to-media interface, and yellow dashed line outlines ppl- and ecto-to-YSL interfaces; animal pole to the right.
All embryos animal pole up; dorsal (a,b) and lateral (c,d,e,f) views with dorsal right; scale bars, 200µm (a,c), 100µm (e), and 20µm (f).

