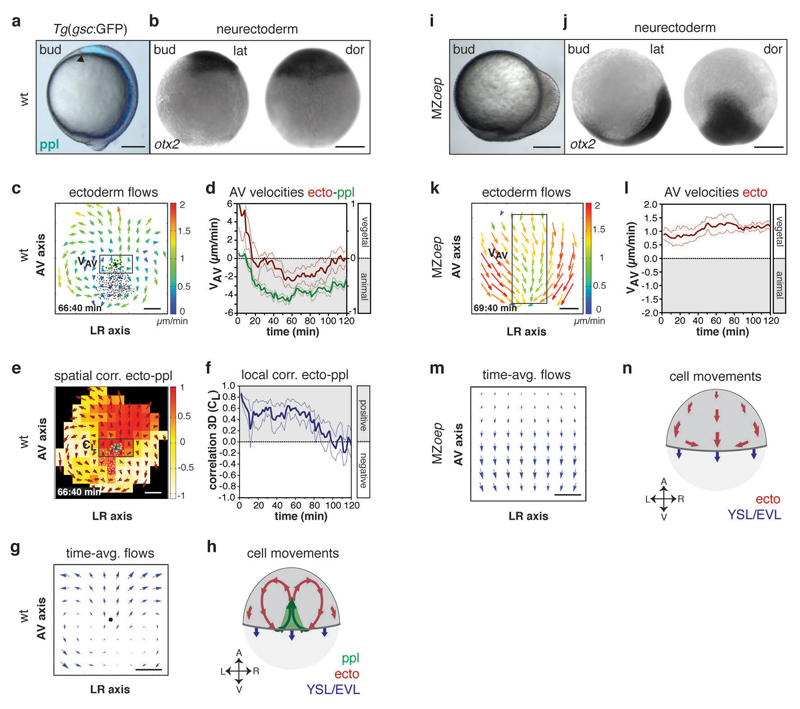
Figure 2. Defective neurectoderm (ecto) morphogenesis in MZoep mutants.
(a,i) Brightfield/fluorescence images of Tg(gsc:GFP) wt (a) and MZoep mutant embryos (i) at the end of gastrulation (bud stage, 10hpf); arrowhead in (a) marks anterior edge of GFP (blue)-labeled ppl.
(b,j) Anterior neurectoderm progenitor cells in a wt (b) and MZoep embryo (j) at bud stage (10hpf) visualized by whole-mount in situ hybridization of otx-2 mRNA.
(c,k) 2D tissue flow map indicating average velocities of ecto movements along the animal-vegetal (AV) and left-right (LR) axis at the dorsal side of a wt (c; 7.1hpf) and MZoep embryo (k; 7.2hpf); local average ecto velocities color-coded ranging from 0 (blue) to 2 (red) µm/min; positions of all/leading edge ppl cells marked by black/green dots; boxed areas are used for measurements in (d,l).
(d,l) Mean velocities along the AV axis (VAV) of ecto (red; right y-axis; boxed area in c,k) and underlying ppl leading edge cells (green, left y-axis) in wt (d; n=6 embryos) and MZoep embryos (l; n=4 embryos); 6-8hp; error bars, s.e.m..
(e) 3D directional correlation between ecto and ppl in a wt embryo at 7.1hpf; color-coded correlation ranging from 1 (red, highest) to -1 (white, lowest); red arrows indicate local averaged ecto velocities; boxed area was used for measurements in (f).
(f) 3D average directional correlation between leading edge ppl and adjacent neurectoderm cells (black boxed area in e) used for local correlation (CL) calculation in wt embryos (n=6 embryos); 6-8hpf; error bars, s.e.m.
(g,m) 2D tissue flow map of ecto cells showing time-averaged velocities (over 120min from 3 embryos) along the AV and LR axes at the dorsal side in wt (g) and MZoep embryos (m); black dot in (g) marks position of ppl leading edge.
(h,n) Schematic of ecto (red), ppl (green), and enveloping layer (EVL)/yolk syncytial layer (YSL) movements (blue) in wt (h) and MZoep embryos (n); arrows indicate AV and LR embryonic axes.
All embryos animal pole up; dorsal [b,j (dor) and h,n] and lateral [a,i and b,j(lat)] views with dorsal right; scale bars, 200µm (a,b,i,j) and 100µm (c,e,k,m).

