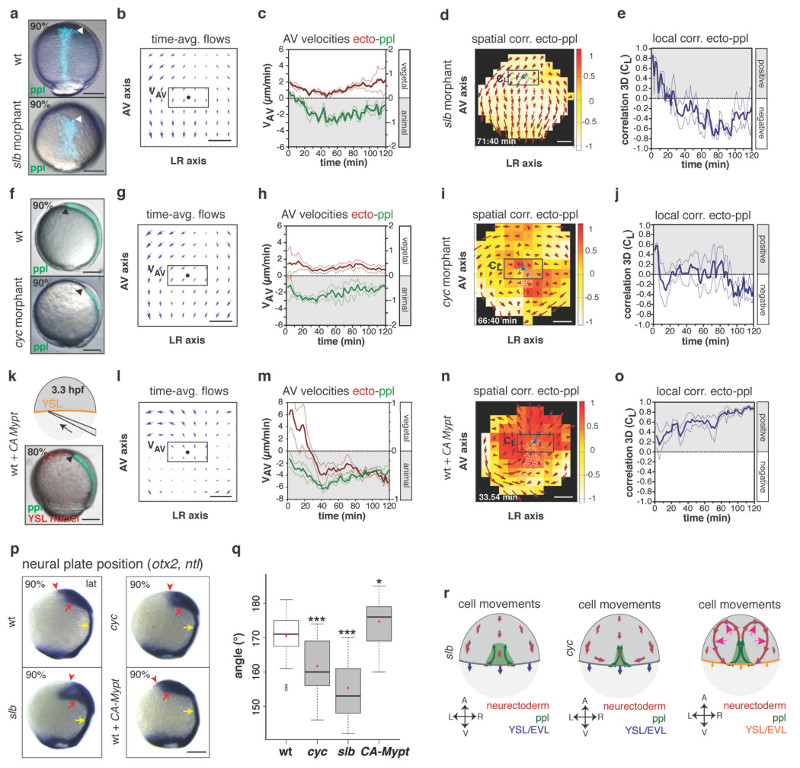
Figure 3. Prechordal plate (ppl) velocity determines the effect of ppl on neurectoderm (ecto) morphogenesis.
(a,f,k) Brightfield/fluorescence images of a Tg(gsc:GFP) wt (a,f; top panel), slb (a; bottom panel) and cyc morphant embryo (f, bottom panel) at 9hpf; Tg(gsc:GFP) embryo (k) injected at 3.3hpf with CA-Mypt and H2A-mCherry mRNAs into the YSL (top panel, schematic) at 8hpf; arrowheads mark GFP (green/blue)-labeled ppl leading edge.
(b,g,l) 2D tissue flow map of time-averaged velocities of ecto cells (over 120min from 3 embryos) along animal-vegetal (AV) and left-right (LR) axes at the dorsal side of slb (b), cyc (g) and CA-Mypt injected embryos (l); black dots; ppl leading edge positions; boxed areas used for measurements in (c,h,m).
(c,h,m) Mean velocities along the AV axis (VAV) of ecto (red; right y-axis; boxed areas in b,g,l) and underlying leading edge ppl cells (green, left y-axis) in slb (c; n=4 embryos), cyc (h; n=3 embryos) and CA-Mypt injected embryos (m; n=4 embryos); 6-8hpf; error bars (dashed lines), s.e.m.
(d,i,n) 3D directional correlation map between ecto and ppl cells in a slb (d; 7.1hpf), cyc (i; 7.2hpf) and CA-Mypt-injected embryo (n; 6.6hpf); color-coded correlation ranging from 1 (red, highest) to -1 (white, lowest); red arrows; local averaged ecto velocities; boxed areas used for measurements in (e,j,o).
(e,j,o) 3D average directional correlation between leading edge ppl and ecto cells (boxed areas in d,I,n) in slb (e; n=4 embryos), cyc (j; n=3 embryos) and CA-Mypt-injected embryos (o; n=4 embryos); 6-8hpf; error bars (dashed lines), s.e.m.
(p) Anterior neural anlage and notochord labeled by otx2 (red arrows) and ntl expression (yellow arrows), respectively, in wt, slb, cyc and CA-Mypt-injected embryos at 9hpf; arrowheads denote anterior neural plate edge.
(q) Angle (°) between the vegetal pole and neural plate anterior edge in wt, slb, cyc and CA-Mypt-injected embryos at 9hpf; student’s t-test (P value indicated) for all graphs; ***, P<0.001; *, P<0.05; n (embryos from 4 independent experiments) wt/cyc/slb/CA-Mypt=36(<0.001)/39(<0.001)/17(<0.0001)/22(0.0194); box plot centre, median; red dot, mean; upper whisker, maximum; lower whisker, minimum.
(r) Schematic of ecto (red), ppl (green) and enveloping layer (EVL)/yolk syncytial layer (YSL) (blue/orange) movements in slb (f), cyc (l) and CA-Mypt-injected (r; magenta arrows;increased vortex flow) embryos; arrows;AV and LR axes.
All embryos animal pole up; dorsal (f) and lateral (a,k,p) views with dorsal right; scale bars, 200µm (a,f,k,p) or 100µm (b,g,l,d,i,n).

