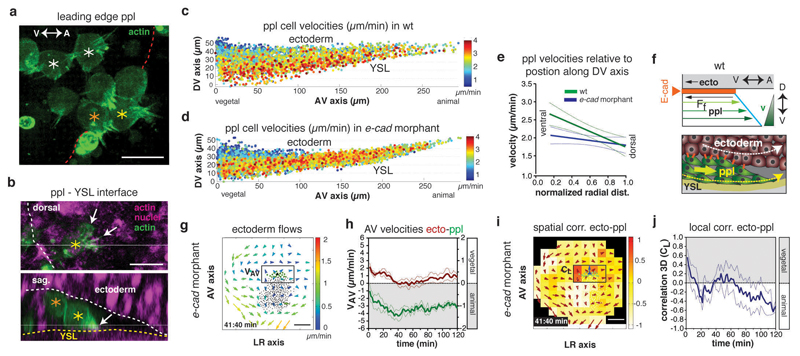
Figure 6. E-cadherin-mediated friction forces between prechordal plate (ppl) and neurectoderm (ecto) determine ecto morphogenesis.
(a,b) Confocal images of leading edge (red dots) ppl donor cells expressing lifeact-GFP (actin, green) transplanted in host embryo labeled with Utrophin-Cherry (actin, purple) and H2A-mCherry (nuclei, purple); asterisks, ppl cells at YSL interface (yellow), between YSL and ecto (orange), and at ecto interface (white); dorsal view as maximal z-stack projection (a); dorsal (top) and sagittal (bottom) confocal sections with ppl protrusions (arrows) and interfaces to YSL (yellow dots) and ecto (white dots) indicated (b).
(c,d) Average instantaneous velocities of migrating ppl cells in wt (c) and e-cadherin morphant embryo (d) along the AV and DV axis color-coded from 0 (blue) to 4 (red) µm/min.
(e) Linear regression lines of binned mean velocities of ppl cells along the normalized radial distance of the DV axis from ventral (0) to dorsal (1) for wt (green; P=0.0006, n=6 embryos) and e-cadherin morphant embryos (blue; P=0.15; n= 4 embryos); P values from F-test with null hypothesis; P > 0.05, slope equals zero; error bars s.e.m.
(f) Schematic illustrating ppl (yellow arrow) dragging ecto cells (white arrow) and friction forces slowing down ppl cells at the ppl-ecto interface (bottom), leading to a linear velocity gradient within ppl (top); Ff, friction force; E-cadherin, orange line/dots.
(g) 2D tissue flow map indicating velocities of ecto cell movements along the AV (VAP) and left-right (LR) (VLR) axis at the dorsal side of a e-cadherin morphant embryo at 6.7hpf; local average ecto velocities indicated and color-coded from 0 (blue) to 2 (red) µm/min; positions of all/leading edge ppl cells, black/green dots; boxed area used for measurements in (h).
(h) Mean velocities along the AV axis (VAV) of ecto (red; boxed area in g; right y-axis) and underlying ppl leading edge cells (green, left y-axis) in e-cadherin morphant embryos (n=4 embryos); 6-8hpf; error bars, s.e.m.
(i) 3D directional correlation between leading edge ppl and adjacent ecto cells in a e-cadherin morphant embryo at 6.7hpf; correlation color-coded from 1 (red, highest) to -1 (white, lowest); red arrows, local averaged ecto velocities; boxed area used for measurements in (j).
(j) 3D directional correlation values between leading edge ppl and adjacent ecto cells (boxed area in i) in e-cadherin morphant (n=4 embryos); 6-8hpf; error bars, s.e.m.
Scale bars 20µm (a,b) and 100µm (g,i); arrows; AV and DV axes

